5.5.1.4 Org Unit
Understanding Org Unit performance is of strategic importance to financial services institutions. The “Org Unit” report here is similar to the one we have in the Management Ledger Reporting section except for the fact that the reports are populated on the back off Instrument Summary data with additional reporting.
You can use a series of Report Prompts, as previously described, to filter
the data. In addition, there are In-Report prompt selections to select the Top/ Bottom N
org units that you are interested in, and the corresponding data will be displayed.

Figure 5-87 Select Income Statement Reporting Line

The report displays the underlying data according to the following Charts:
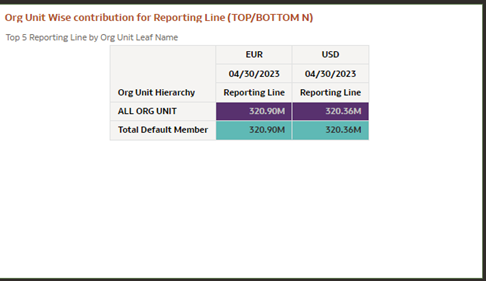
- Org Unit Wise contribution for Reporting Line (TOP N);
the same is available for bottom view
In this chart, for the selected reporting line, the Top N (N selected from the chart prompt) and bottom N organization units are displayed in descending order of value of the reporting line.
Figure 5-88 Org Unit Wise contribution for Reporting Line (TOP N)
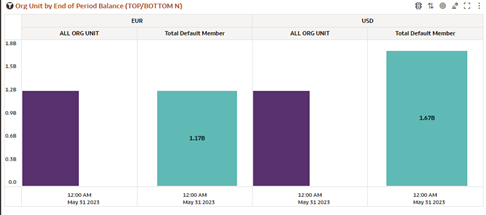
- Org Unit by End of Period Balance (TOP N); the same is
available for bottom view:The chart displays the Top N (N selected from the chart prompt) and bottom N organization units sorted in a descending order by End of Period Balances.
Figure 5-89 Org Unit by End of Period Balance (TOP N)
- Key Business Metrics by Org Unit (TOP N); the same is
available for bottom view:The chart displays the Top N (N selected from the chart prompt) and bottom N organization units sorted in a descending order by End of Period Balances and provides the breakup between Asset and Liability Balances along with Regulatory and Economic Capital.
Figure 5-90 Key Business Metrics by Org Unit (TOP/ BOTTOM N)
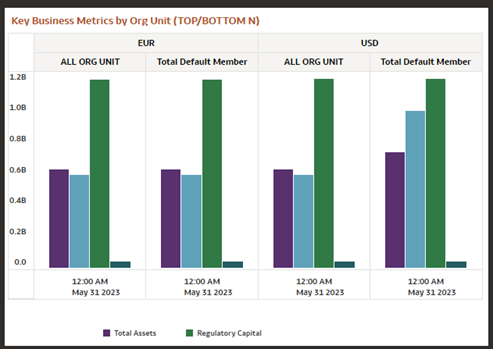
- Total Assets and Total Liabilities: Total Asset and Total Liability Balances.
- Regulatory Capital: Regulatory Capital is by definition similar to that of Economic capital except for the fact that unlike economic capital, regulatory capital is calculated as per regulations laid down by banking regulators in a country.
- Economic Capital: Economic Capital is the amount of risk capital, which a firm requires to cover the risks that it is running on books and collecting as a risk taking enterprise. These risks are typically market risk, credit risk, legal risk, and operational risk. It is the amount of capital that is needed by the bank to stay solvent.
- Key Performance Metrics by Org Unit (TOP N); the same is
available for bottom view: The chart displays the Top N (N selected
from the chart prompt) and bottom N organization units sorted in a descending order
by End of Period Balances and provides selected KPI’s like NIM, RAROC, ROE and ROTA
of these Org Units.
Figure 5-91 Key Performance Metrics by Org Unit (TOP/ BOTTOM N)
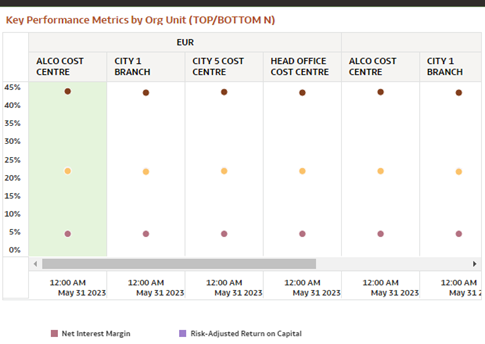
- Net Interest Margin: NIM is usually Net Interest Income expressed as a percentage that is, it is the net interest income a bank or financial institution earns in percentage terms on the average interest-earning assets in a specified period.
- Return on Total Assets: Return on Total Assets (ROTA) is a ratio that measures a company's earnings before taxes (NIBT) relative to its total Assets. It is expressed as a percentage.
- Risk Adjusted Return on Capital: Risk Adjusted Return on Capital is a ration that measures the financial health of the financial institution. Here NIBT is divided by Unexpected Losses and expressed as a percentage.
- Return on Equity: Return on equity (ROE) is the measure of a bank's net income divided by its shareholders' equity. ROE is a gauge of a corporation's profitability and how efficiently it generates those profits. The higher the ROE, the better a company is at converting its equity financing into profits.
- Other Ratios by Org Unit (TOP N); the same is available for
bottom view: The chart displays the Top N (N selected from the chart
prompt) and bottom N organization units sorted in a descending order by End of
Period Balances and provides selected business metrics like Net Fee Income, Gross
Interest Income, Interest Coverage Ratio and Debt coverage ratio, all expressed as
percentages.
Figure 5-92 Other Ratios by Org Unit (TOP/ BOTTOM N)
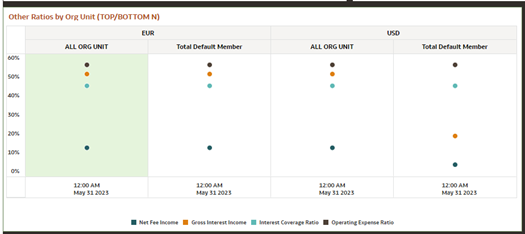
- Net Fee Income: Net Fee Income is the revenue generated by the bank from fees and commissions less the waivers expressed as a percentage of Total End of Period Balances.
- Gross Interest Income: Gross Interest Income is the total interest paid by the borrower to the bank relative to its total outstanding balances. It does not account for any interest expenses incurred by the bank or any kind of fees or charges. It is expressed as a percentage.
- Interest Coverage Ratio: The Interest Coverage Ratio measures a bank’s ability to meet required interest expense payments related to its outstanding obligations. It is expressed as a ratio of NIBT with Total Interest Expenses expressed as a percentage.
- Operating Expense Ratio: Operating Expense ratio compares operating expenses to Total Revenue. It is a common metric financial institutions use to determine how efficient their management is at keeping operating costs low while also earning revenue.