5.5.1.3 Report Data Action
Figure 5-81 Data Action Configuration in Org Unit canvas
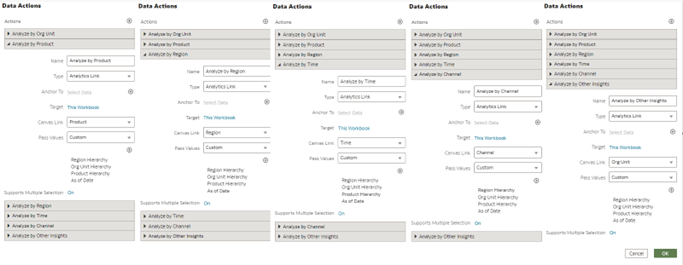
From every chart available in Org Unit you can select a value, and then navigate to the Product, Region and Other Insights canvas.
Figure 5-82 Data Action Configuration in Product canvas
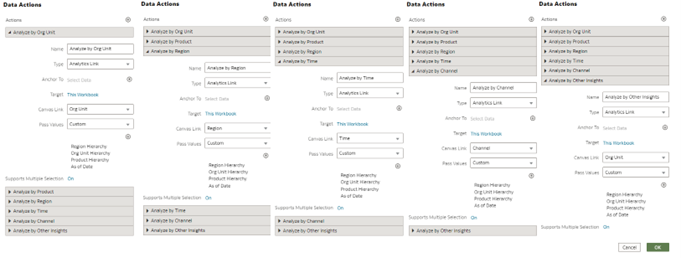
From every chart available in Product you can select a value, and then navigate to the Org Unit, Region and Other Insights canvas.
Figure 5-83 Data Action Configuration in Region canvas
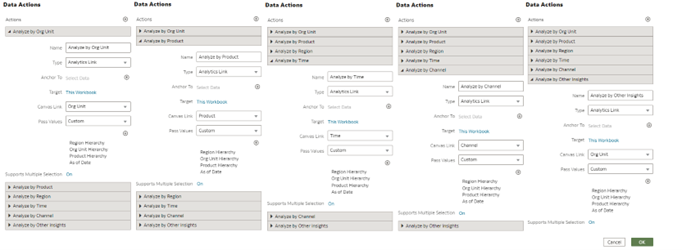
From every chart available in Region, you can select a value, and then navigate to the Org Unit, Product and Other Insights canvas.
Figure 5-84 Data Action Configuration in Time canvas
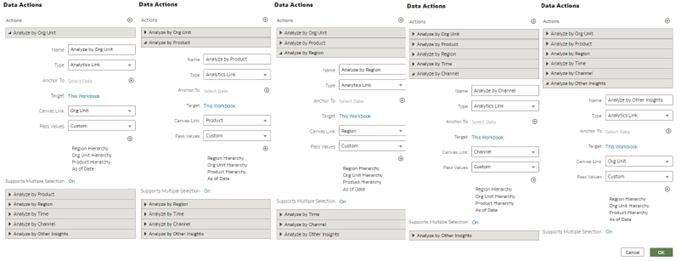
From every chart available in Other Insights, you can select a value, and then navigate to the Org Unit, Product and Region canvas.
Figure 5-85 Data Action Configuration in Channel canvas
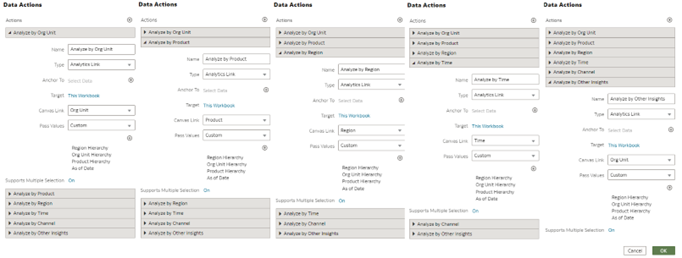
From every chart available in Region, you can select a value, and then navigate to the Org Unit, Product, Region, Time and Other Insights canvas.
Figure 5-86 Data Action Configuration in Other Insights canvas
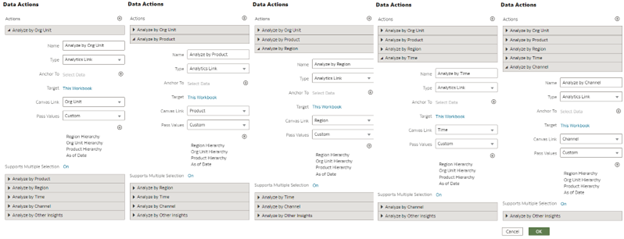
From every chart available in Other Insights, you can select a value, and then navigate to the Org Unit, Product and Region canvas.
In order to do so, with a right click on the chart selection, the data action option (Analyze) will appear for you to be able to pass on the data filters to the canvas that you select.