Performance Review
The Performance Review 1 screen provides an overview of Oracle Analytics query performance, focusing on average run times and identifying objects with longer execution times.
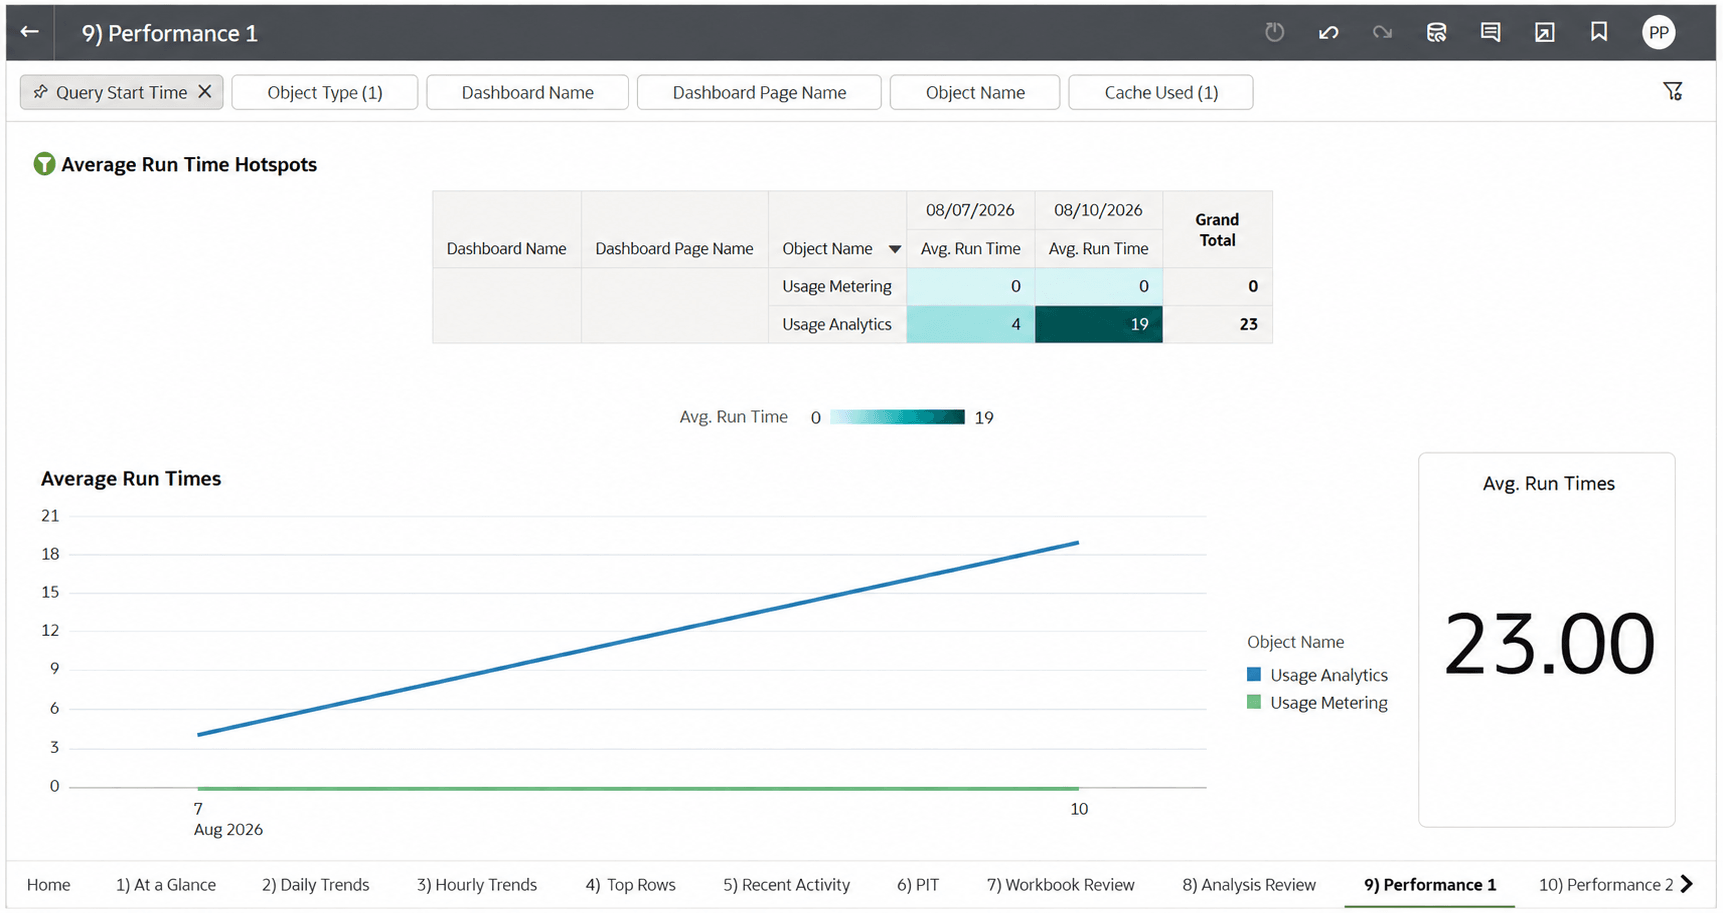
Figure 9-50 Performance 1
The Average Run Time Hotspots table highlights objects with higher average run times across the selected dates. The Average Run Times chart shows how execution time changes across the selected dates. A tooltip can be displayed by selecting a data point to view details such as average run time, object name, and query start date.
The top section provides filters to narrow the displayed results based on:
- Query Start Time
- Object Type
- Dashboard Name
- Dashboard Page Name
- Object Name
- Cache Used