Performance Review-2
The Performance Review 2 screen provides a distribution-based view of Oracle Analytics query execution times, helping users analyze the range and variability of query performance by day.
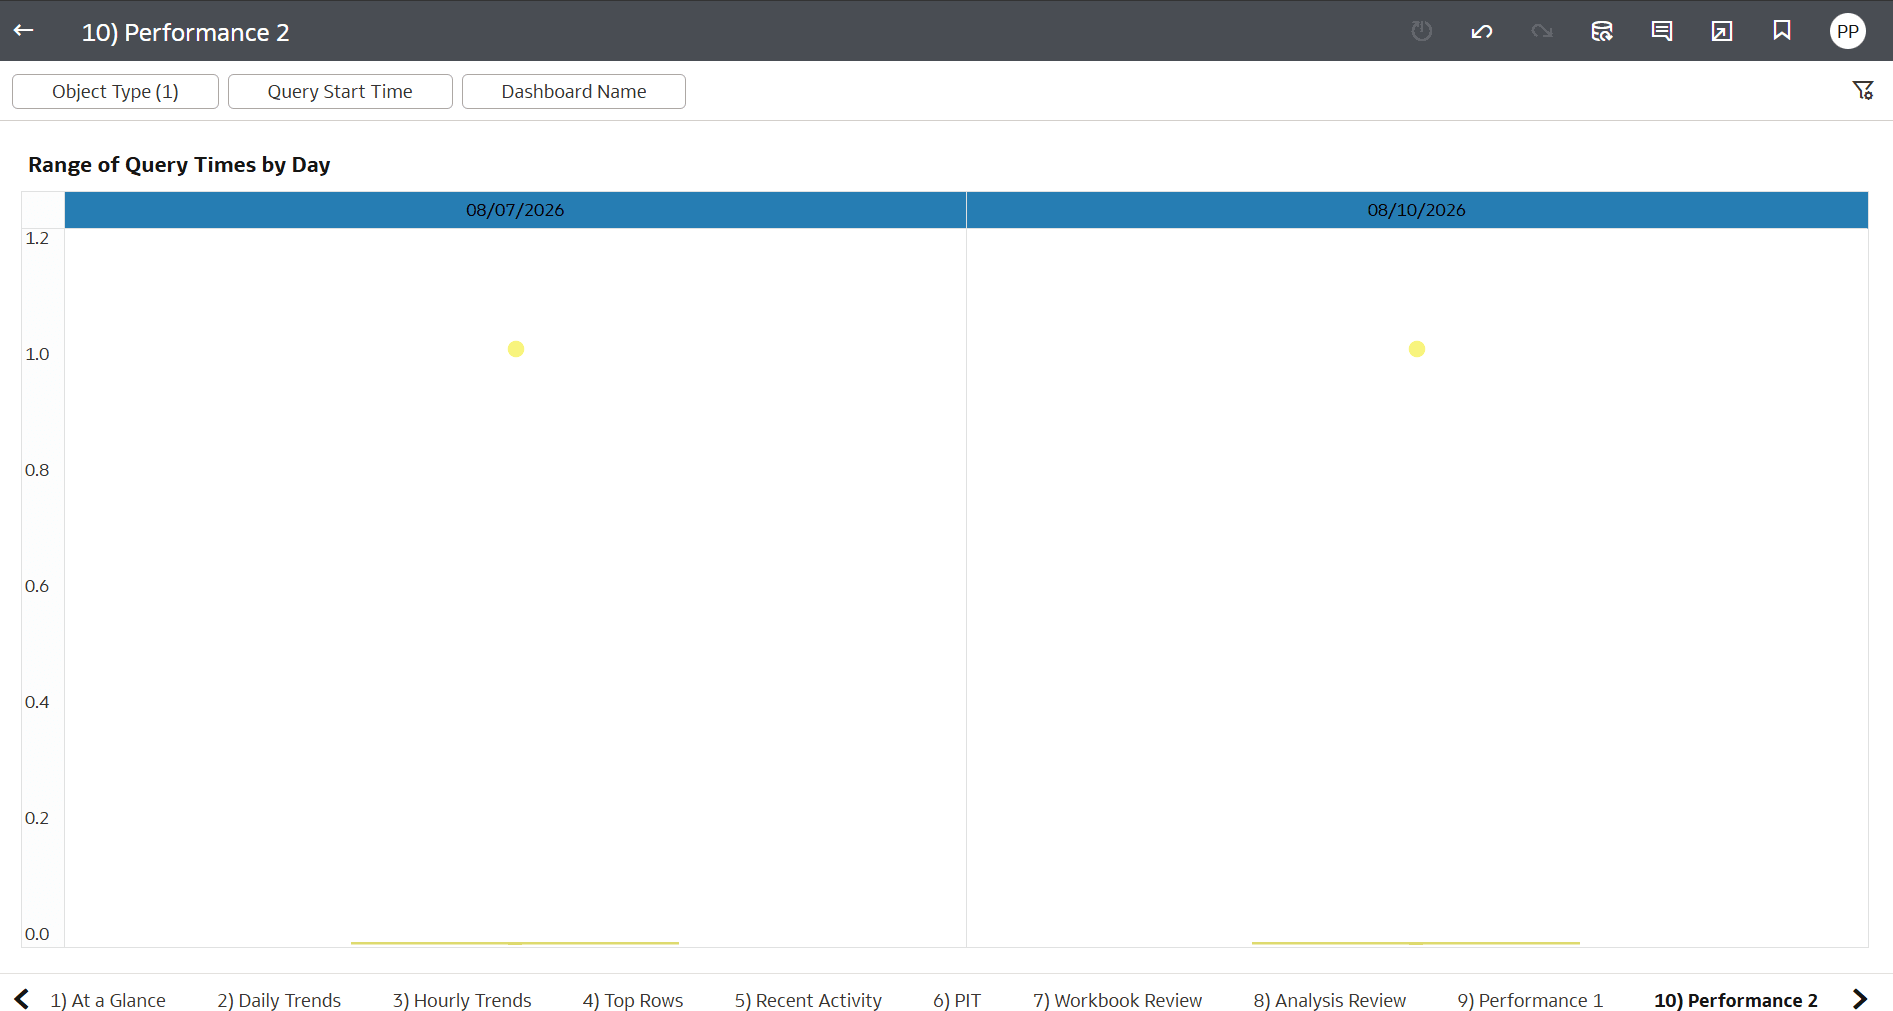
Figure 9-51 Performance Review 2
The Range of Query Times by Day visualization compares query timing data for the selected dates. The chart uses a distribution-style view to represent query timing statistics for each date.
The top section provides filters to narrow the displayed results based on:
- Object Type
- Query Start Time
- Dashboard Name