Rows vs Response
The Rows vs Response screen compares the number of rows returned by queries with their response times to help identify potentially inefficient or high-impact queries.
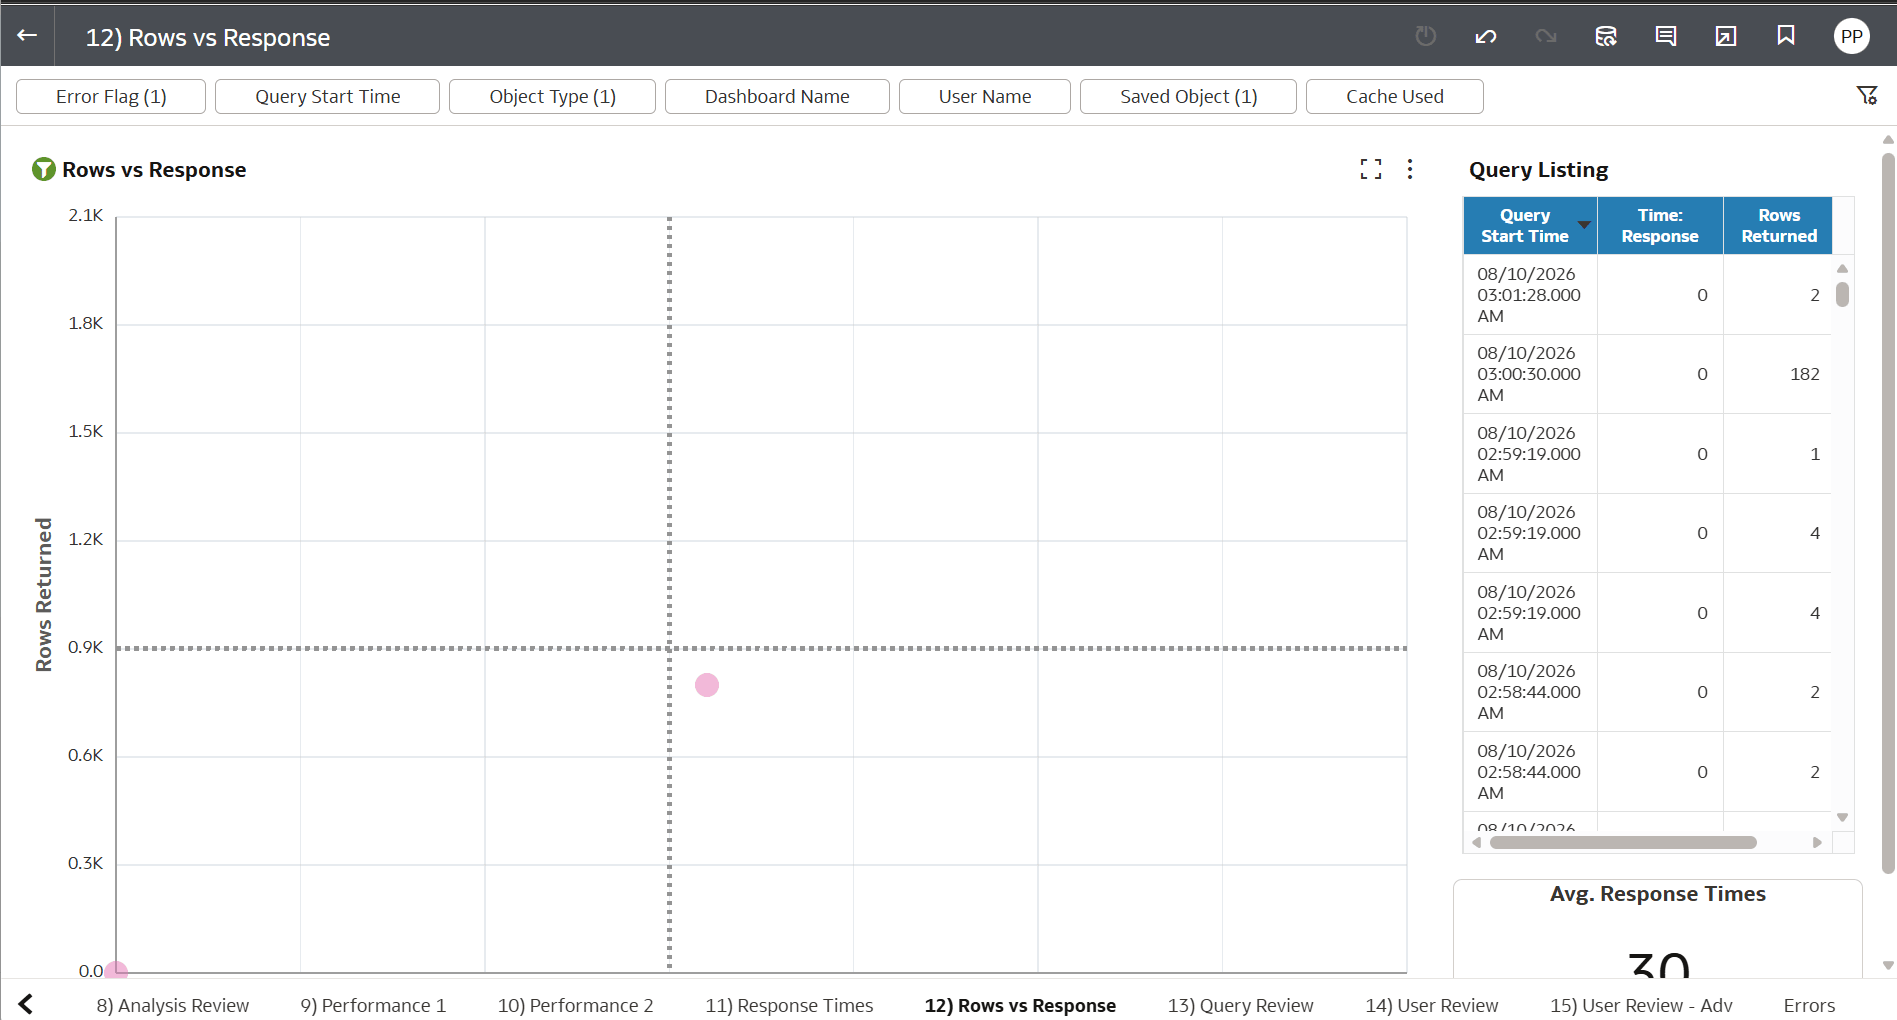
Figure 9-52 Rows vs Responses
The main Rows vs Response scatter plot shows the relationship between:
- Rows Returned on the vertical axis
- Response Time on the horizontal axis
The Query Listing table on the right provides details for individual queries, including:
- Query Start Time Time
- Response Rows Returned
The top section provides filters to narrow the displayed results based on:
- Error Flag
- Query Start Time
- Object Type
- Dashboard Name
- User Name
- Saved Object
- Cache Used