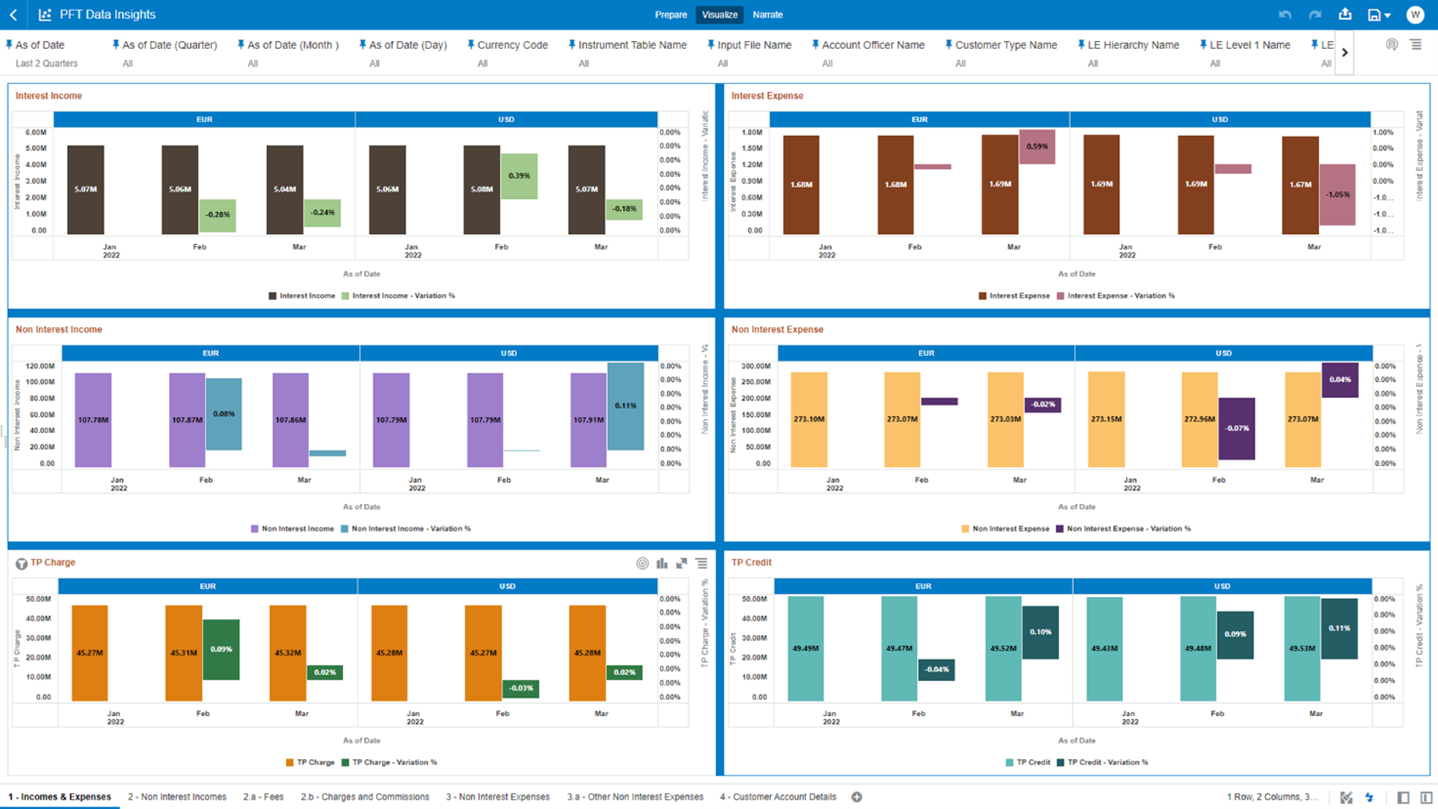
7.1.6.1.3 “1 - Incomes & Expenses”
The “1 - Incomes & Expenses” Report provides a view of the descriptive analytics related to the heads of Income and Expenses.
You can use a series of Report Prompts, as previously described, to filter the data according to Key Attributes pertaining to the underlying Instrument Tables Accounts.
The report displays the underlying data according to the following Charts’ logic:

- Interest Income: The chart displays the absolute value for the Interest Income, as well as the relative percentage variation Interest Income – Variation %, that is calculated over the previous period available Interest Income value. The results are displayed according to the As-of-Date and split by the Currency Code.
- Interest Expense: The chart displays the absolute value for the Interest Expense, as well as the relative percentage variation Interest Expense – Variation %, that is calculated over the previous period available Interest Expense value. The results are displayed according to the As-of-Date and split by the Currency Code.
- Non Interest Income: The chart displays the absolute value for the Non Interest Income, as well as the relative percentage variation Non Interest Income – Variation %, that is calculated over the previous period available Non Interest Income value. The results are displayed according to the As-of-Date and split by the Currency Code.
- Non Interest Expense: The chart displays the absolute value for the Non Interest Expense, as well as the relative percentage variation Non Interest Expense – Variation %, that is calculated over the previous period available Non Interest Expense value. The results are displayed according to the As-of-Date and split by the Currency Code.
- TP Charge: The chart displays the absolute value for the TP Charge, as well as the relative percentage variation TP Charge – Variation %, that is calculated over the previous period available TP Charge value. The results are displayed according to the As-of-Date and split by the Currency Code.
- TP Credit: The chart displays the absolute value for the TP Credit, as well as the relative percentage variation TP Credit – Variation %, that is calculated over the previous period available TP Credit value. The results are displayed according to the As-of-Date and split by the Currency Code.
Figure 7-114 "1 - Incomes & Expenses Report"
