4 Locations and Devices
The Locations and Devices page shows graphical and map-based representations of device status for your enterprise. In the context of Telemetry, a location refers to a CAPS workstation and a device refers to a regular workstation.
Note:
During Cloud Maintenance periods, there may be a gap in Locations and Devices reporting.Tip:
To see a larger version of an image, right-click on the image to open it in a new browser tab.Status
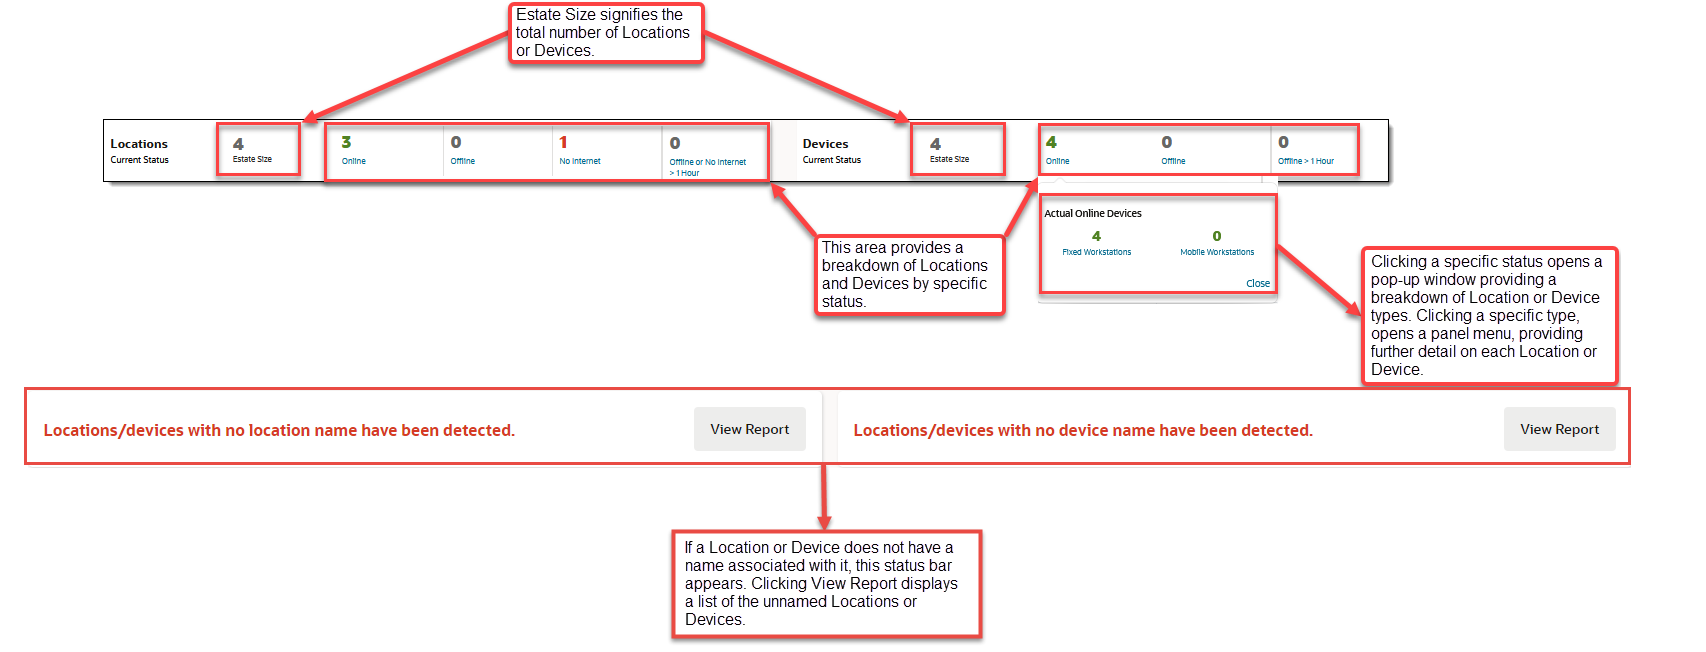
Locations Current Status and Devices Current Status show a live, general overview of location and device status within your enterprise. The following image provides more information:
Figure 4-1 Locations and Devices Status Bar

| Area | Description |
|---|---|
|
Estate Size |
The total number of locations and devices. |
|
Online Locations |
CAPS workstations that are operational and connected to the cloud service. |
|
Offline Locations |
CAPS workstations that have not contacted the cloud service nor posted a transaction within the last five minutes. |
|
Locations with no internet |
The cloud service cannot communicate with the CAPS workstation. |
|
Locations Offline or have No Internet for >1 Hour |
CAPS workstations that have not contacted cloud service,
or vice versa, in over 1 hour.
Note: If locations are offline/have no internet for 1 hour or longer, a warning status is displayed. If locations are offline/have no internet for 24 hours or longer, a critical status is displayed. |
|
Online Devices (Workstations) |
Workstations that are operational and connected to the cloud service. |
|
Offline Devices (Workstations) |
Workstations that have not contacted the cloud service within the last five minutes. |
|
Devices (Workstations) Offline for >1 Hour |
Workstations that have not contacted the cloud service in
over 1 hour.
Note: If more than 20% of workstations are offline for 4 hours longer, a warning status is displayed. If more than 20% of workstations are offline for 24 hours or longer, a critical status is displayed. |
|
Fixed Workstations |
Traditional Point of Sale (POS) devices. |
|
Mobile Workstations |
Handheld/Tablet Point of Sale (POS) devices. |
Offline Locations and Devices
This graph tracks the following data in 5-minute snapshots over the last 24 hours:
Figure 4-2 Offline Locations and Devices Graph

The following table describes the information shown in the graph:
| Callout Number | Area/Task | Description/Procedure |
|---|---|---|
|
1 |
Graph View |
This area displays the data, represented as a line graph. Hover your cursor over a data point to view more details. |
|
2 |
Legend |
This area displays the following types of data represented
within the graph:
Click a desired data type in the legend to display only that data in the graph. In the example figure above, the graph is set to display data for Locations with no Internet and Offline locations. |
|
3 |
View Report |
Click the Report icon ( |
|
4 |
Maximize/Minimize Graph |
Click the Maximize icon ( |
Device Hours Offline
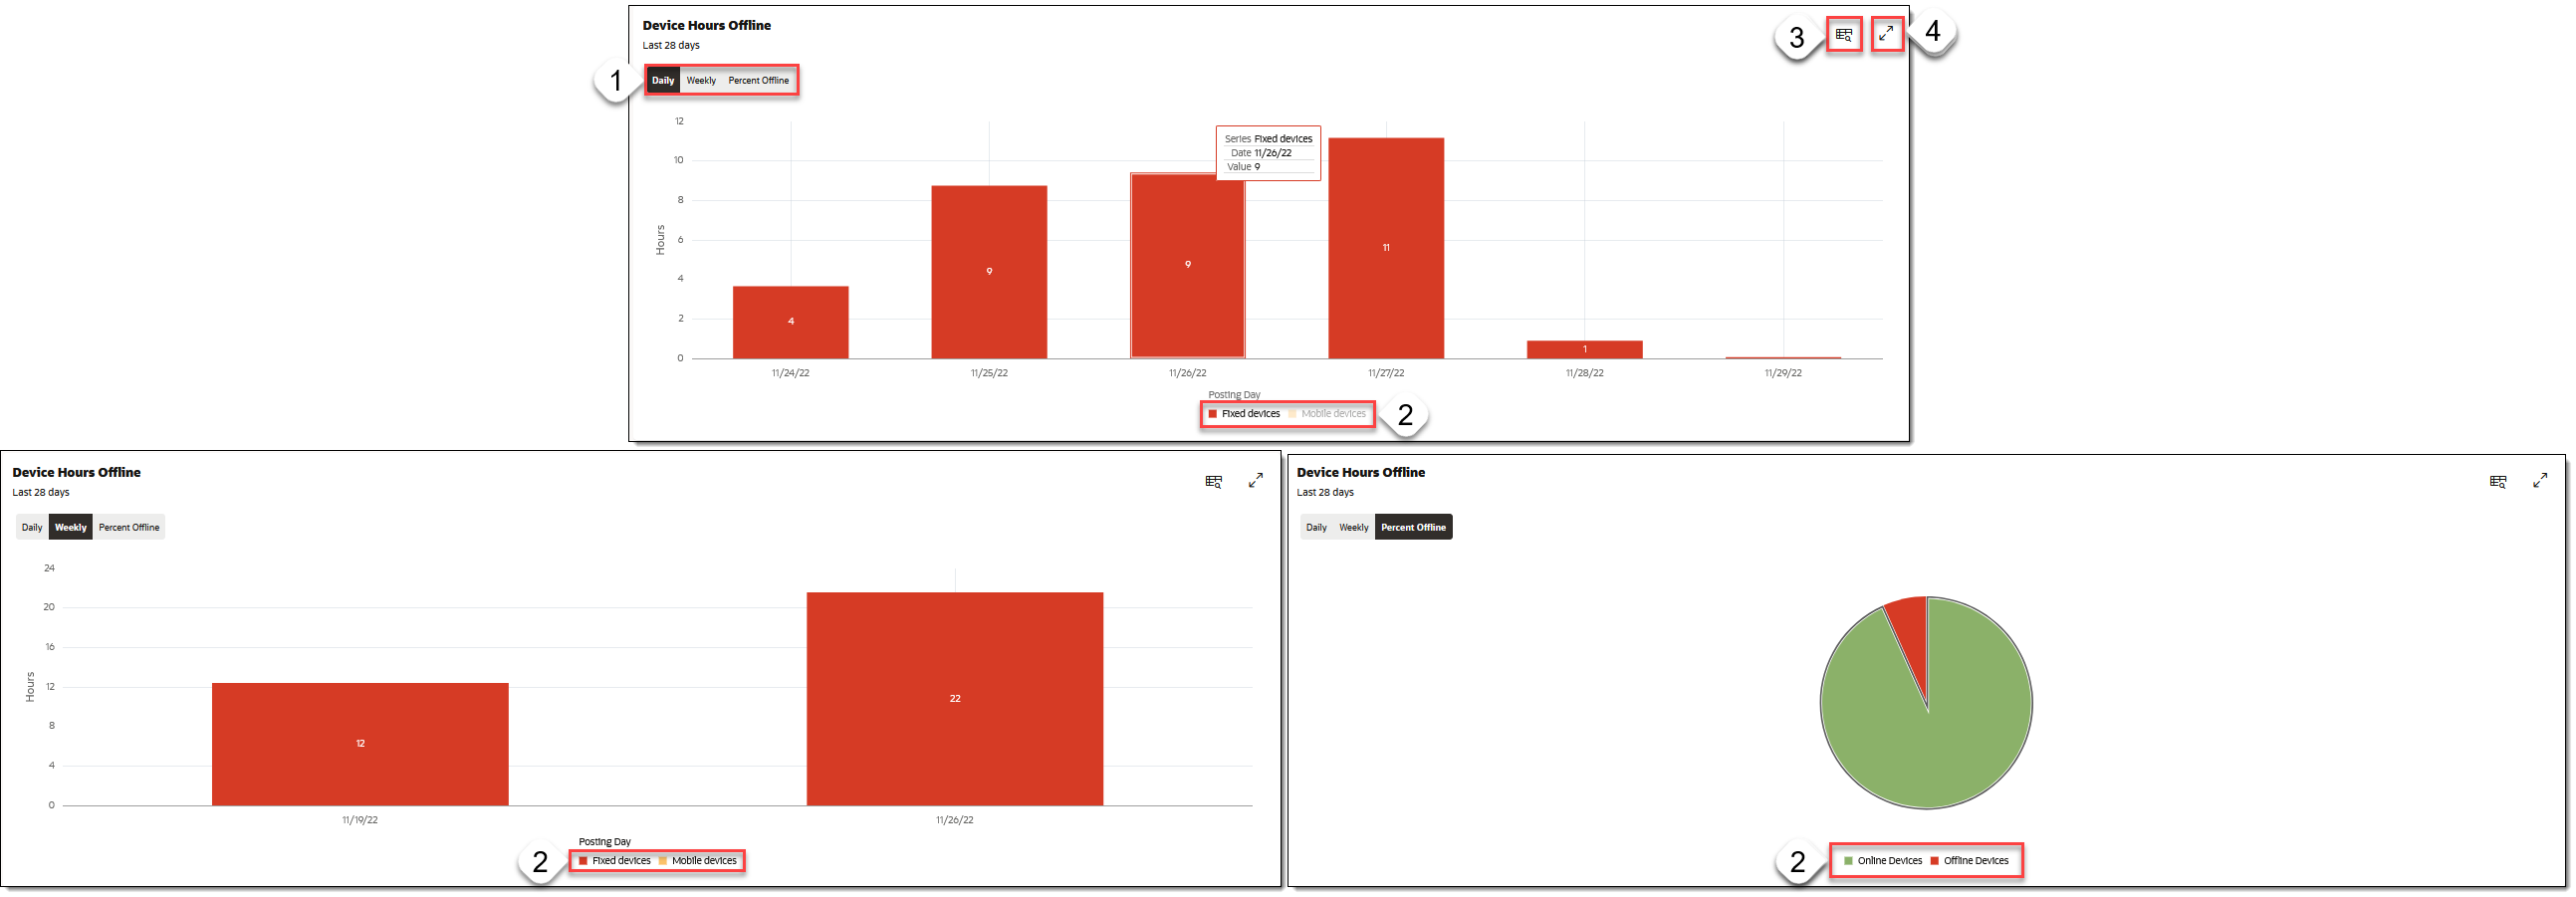
This graph shows the number of hours that devices have been offline. You can adjust the graph to view data for the current day, past week, or a percentage of online versus offline.
Figure 4-3 Device Hours Offline Graph

The following table describes the information shown in graphs for offline devices:
| Callout Number | Area/Task | Description/Procedure |
|---|---|---|
|
1 |
Graph View |
Choose between the following graph view options:
|
|
2 |
Legend |
This area displays the following types of data represented
within the graphs:
Click a desired data type in the legend to display only that data in the graph. |
|
3 |
View Report |
Click the Report icon ( |
|
4 |
Maximize/Minimize Graph |
Click the Maximize icon ( |
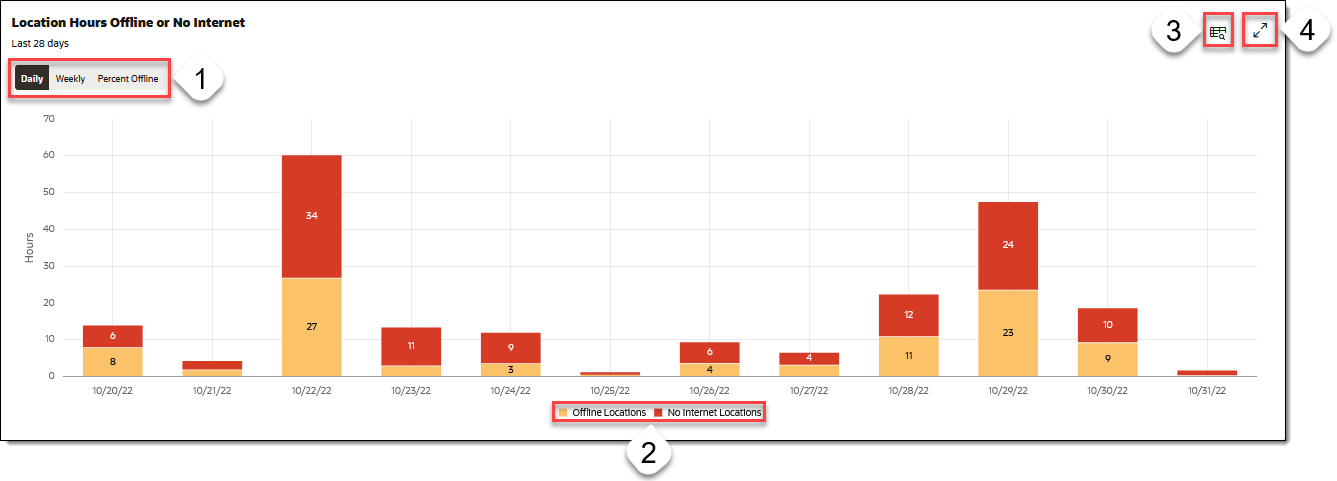
Location Hours Offline and No Internet
Figure 4-4 Location Hours Offline and No Internet Graph

| Callout Number | Area/Task | Description/Procedure |
|---|---|---|
|
1 |
Graph View |
Choose between the following graph view options:
|
|
2 |
Legend |
This area displays the following types of data represented
within the graphs:
Click a desired data type in the legend to display only that data in the graph. |
|
3 |
View Report |
Click the Report icon ( |
|
4 |
Maximize/Minimize Graph |
Click the Maximize icon ( |
Locations Map
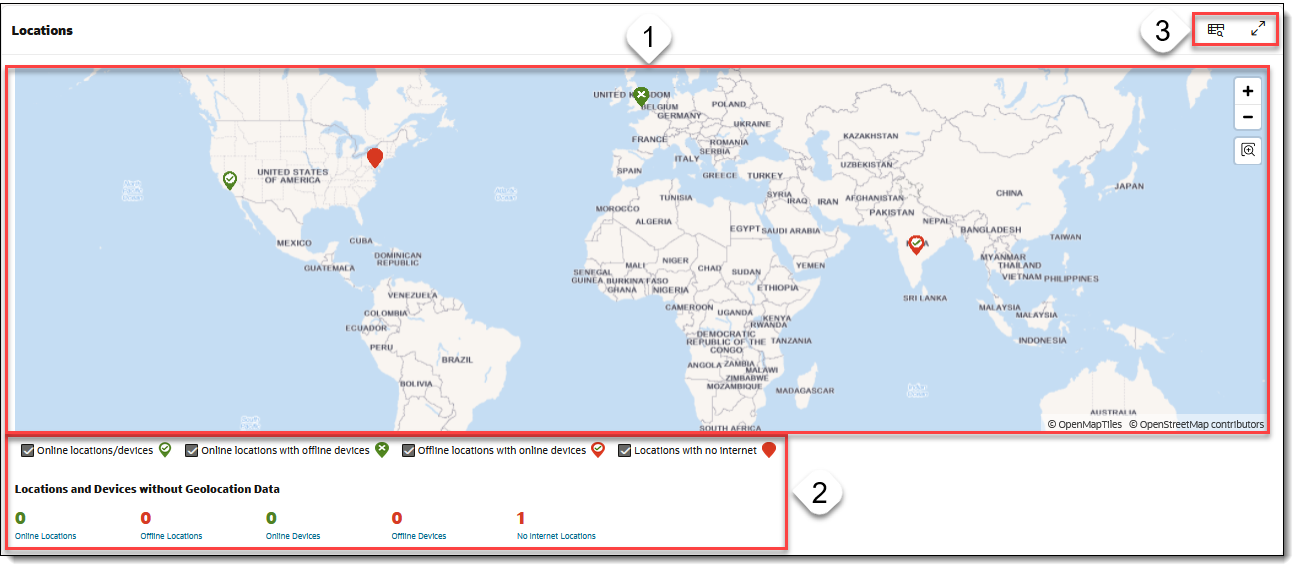
This tile shows a geographical representation of device status:
Figure 4-5 Locations Map

| Callout Number | Area/Task | Description/Procedure |
|---|---|---|
|
1 |
Map View |
This area displays a geographical representation of device status, with each point represented by different graphics. To navigate the map, use the Zoom In/Out functions in the upper-right corner. Clicking a data point on the map opens a small pop-up detailed view of that data. |
|
2 |
Legend |
This area displays the following types of data represented
within the map:
Selecting or deselecting a data point within the legend updates the map view accordingly, displaying only the selected data types. |
|
3 |
View Report Maximize/Minimize Graph |
Click the Report icon ( Click the Maximize
icon ( |