Discrete map graphs
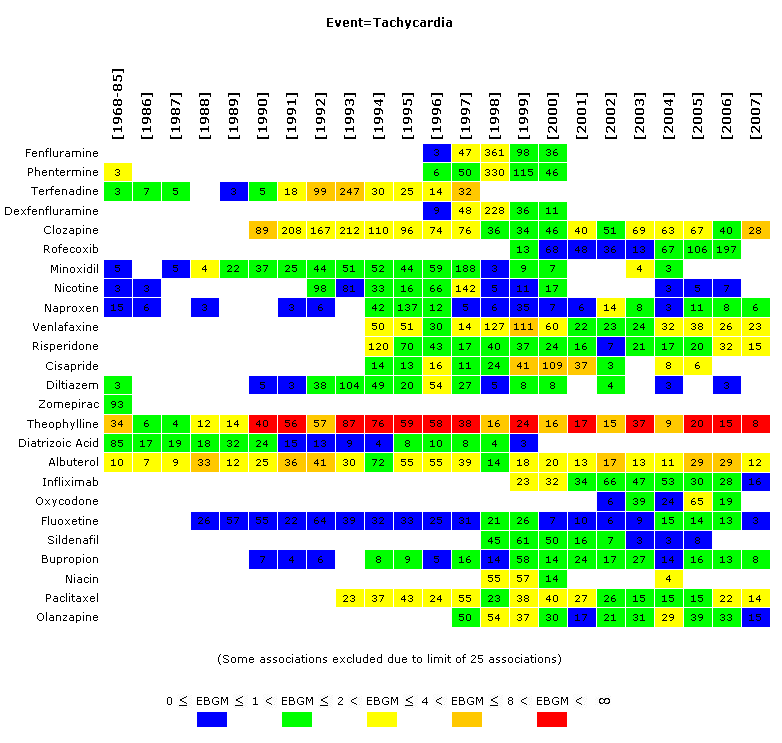
Discrete map graphs provide a way to compare strength of associations between specified drugs and events across multiple discrete (non-cumulative) subsets.
A discrete map graph is available for two-dimensional MGPS results of data mining runs that use non-cumulative subsets. See Subset variables for more information.
Note:
Map graphs show data for multiple subsets. To view data for only a specified subset, click View as a Bar Graph Showing a Single Subset or View as a Single-Subset Bar Graph with Confidence Intervals.The graph key indicates the statistical ranges that determine the cell colors. You can modify the graph key (specifically, the cutpoints and colors) on the Choose Graph page.
If the Notes check box is selected when you display the graph, a Notes section provides information on the selection criteria and display options used for the graph.
The following example is for a two-dimensional data mining run, with the Tachycardia event selected:

Parent topic: Graphs for 2D results