Bar graphs
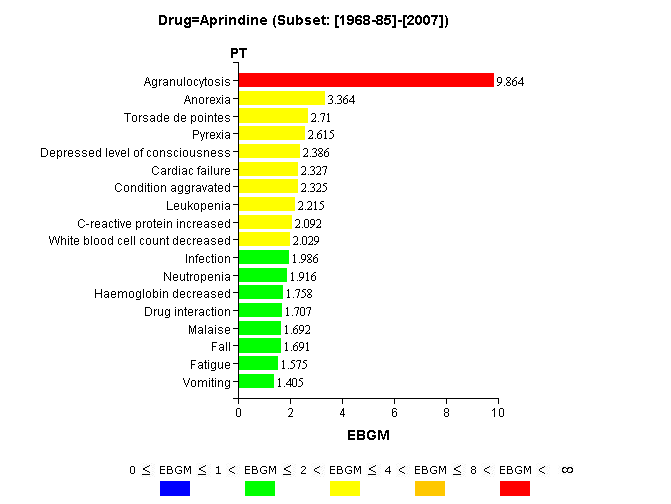
Bar graphs provide a straightforward way to display the items most closely associated with a specified drug or event, showing the strength of association by plotting each computed statistical score as the length of a horizontal bar.
A bar graph is available for two-dimensional results of MGPS data mining runs or logistic regression runs. You can choose a bar graph to display the following scores:
- EBGM, EB05, or N for an MGPS data mining run.
- ERAM, ER05, or N if computed for an MGPS data mining run.
- PRR, if computed for an MGPS data mining run.
- ROR, ROR05, or N, if computed for an MGPS data mining run.
- LROR, LR05, or N for a logistic regression run.
The graph key indicates the statistical ranges that determine the bar colors. On the Choose Graph page, you can modify the graph key (specifically, the cutpoints and colors).
If the Notes check box is checked when you display the graph, a Notes section provides information about the selection criteria and display options used for the graph.
The following example is a two-dimensional data mining run, with the drug Aprindine selected:

Parent topic: Graphs for 2D results