Nested confidence interval graphs
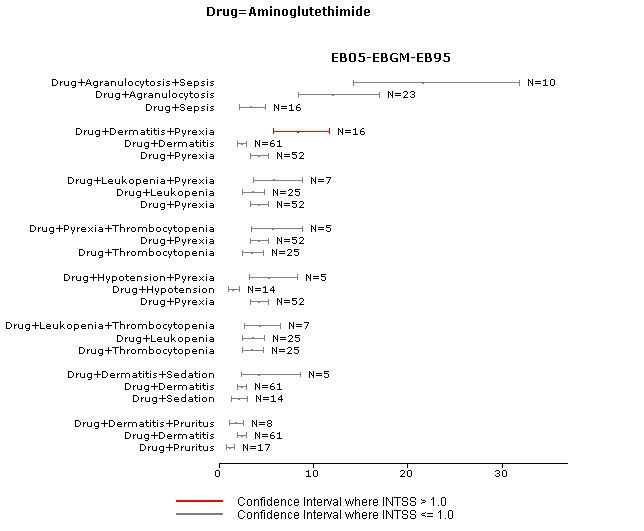
To help you investigate possible drug interactions or multi-event syndromes, the nested confidence interval graph displays sets of confidence intervals.
In each set, the first confidence interval is for the 3D combination for the specified pattern (such as Drug+Drug+Event). Subsequent confidence intervals in the set are for the 2D combinations (such as Drug+Event.)
In each confidence interval bar, the EB05 value is at the left end, the EBGM value is the dot on the bar, and the EB95 value is at the right end. The application highlights a confidence interval bar if its INTSS value is greater than the limit that you specify as a display option. For more information about INTSS, see interaction scores.
To conserve space in labeling, the drug or event name indicated above the graph is referred to by the label Drug or Event in the graph. In the example below, Drug means Aminoglutethimide.
The key below the graph indicates INTSS values represented by the confidence interval bars. Settings you make to cutpoints and palette choices do not affect this graph type.
If Notes is checked when you display the graph, a Notes section provides information about the selection criteria and display options used for the graph.
The following example shows a nested confidence interval graph for a three-dimensional data mining run, with the drug Aminoglutethimide selected. The confidence interval for the 3D combination of that drug and two events appears first, followed by confidence intervals for the specified drug and each of the component events.

Parent topic: Graphs for 3D results