Financial Dashboard
The Financial dashboard contains the following pages:
Parent topic: Oracle Healthcare Foundation Dashboards
Reimbursement Analysis
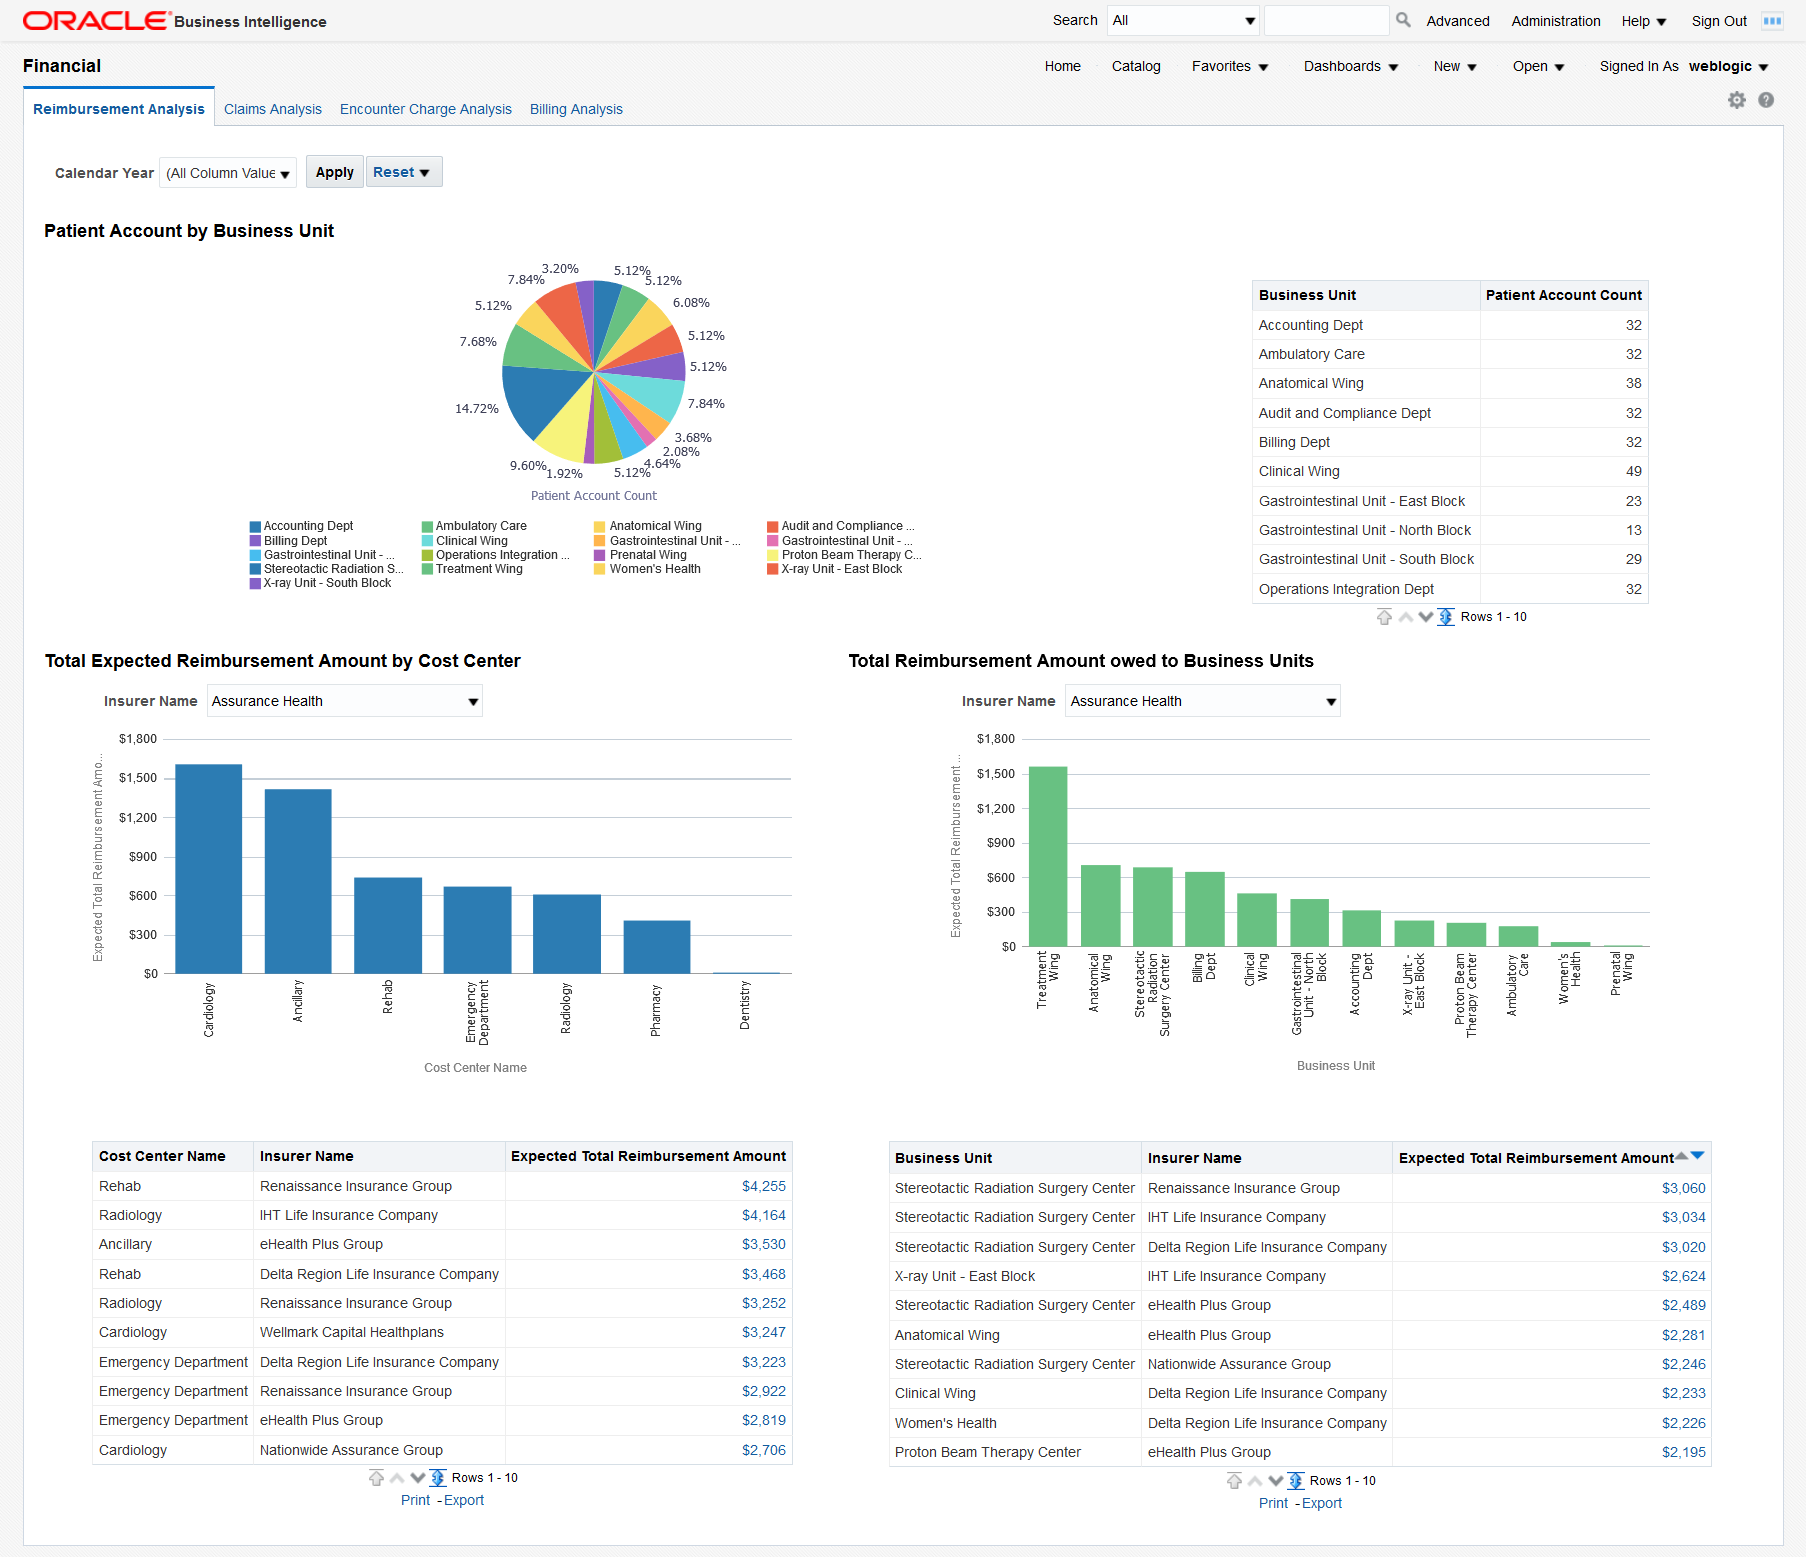
The Reimbursement Analysis page covers the reimbursement amounts for the patient accounts.
Figure 2-12 Reimbursement Analysis Page

You can use the filter at the top of the page to focus on specific calendar years. This page has the following reports:
- Patient Account by Business Unit. This report helps you understand the distribution of patient accounts across business units and it helps in resource planning to manage patient accounts effectively.
- Total Expected Reimbursement Amount by Cost Center, filtered by insurer - This
report indicates the degree to which each insurer impacts the income of different
cost centers. Click on a bar in the graph to display details about all the patients
insured by the selected insurer for that cost center.
A tabular report below the graph lists the expected total reimbursement amounts for all the cost centers and insurers. Click on an amount to display details about all the patients insured by the selected insurer for that cost center.
- Total Reimbursement Amount owed to Business Units, filtered by insurer - This report
indicates the degree to which each insurer impacts the income of different business
units. Click on a bar in the graph to display details about all the patients insured
by the selected insurer for that business unit.
A tabular report below the graph lists the expected total reimbursement amounts for all the business units and insurers. Click on an amount to display details about all the patients insured by the selected insurer for that business unit.
- A tabular report with patient, patient account, and reimbursement amount details. This report allows you to track the details of all the reimbursements that apply to each patient.
Parent topic: Financial Dashboard
Claims Analysis
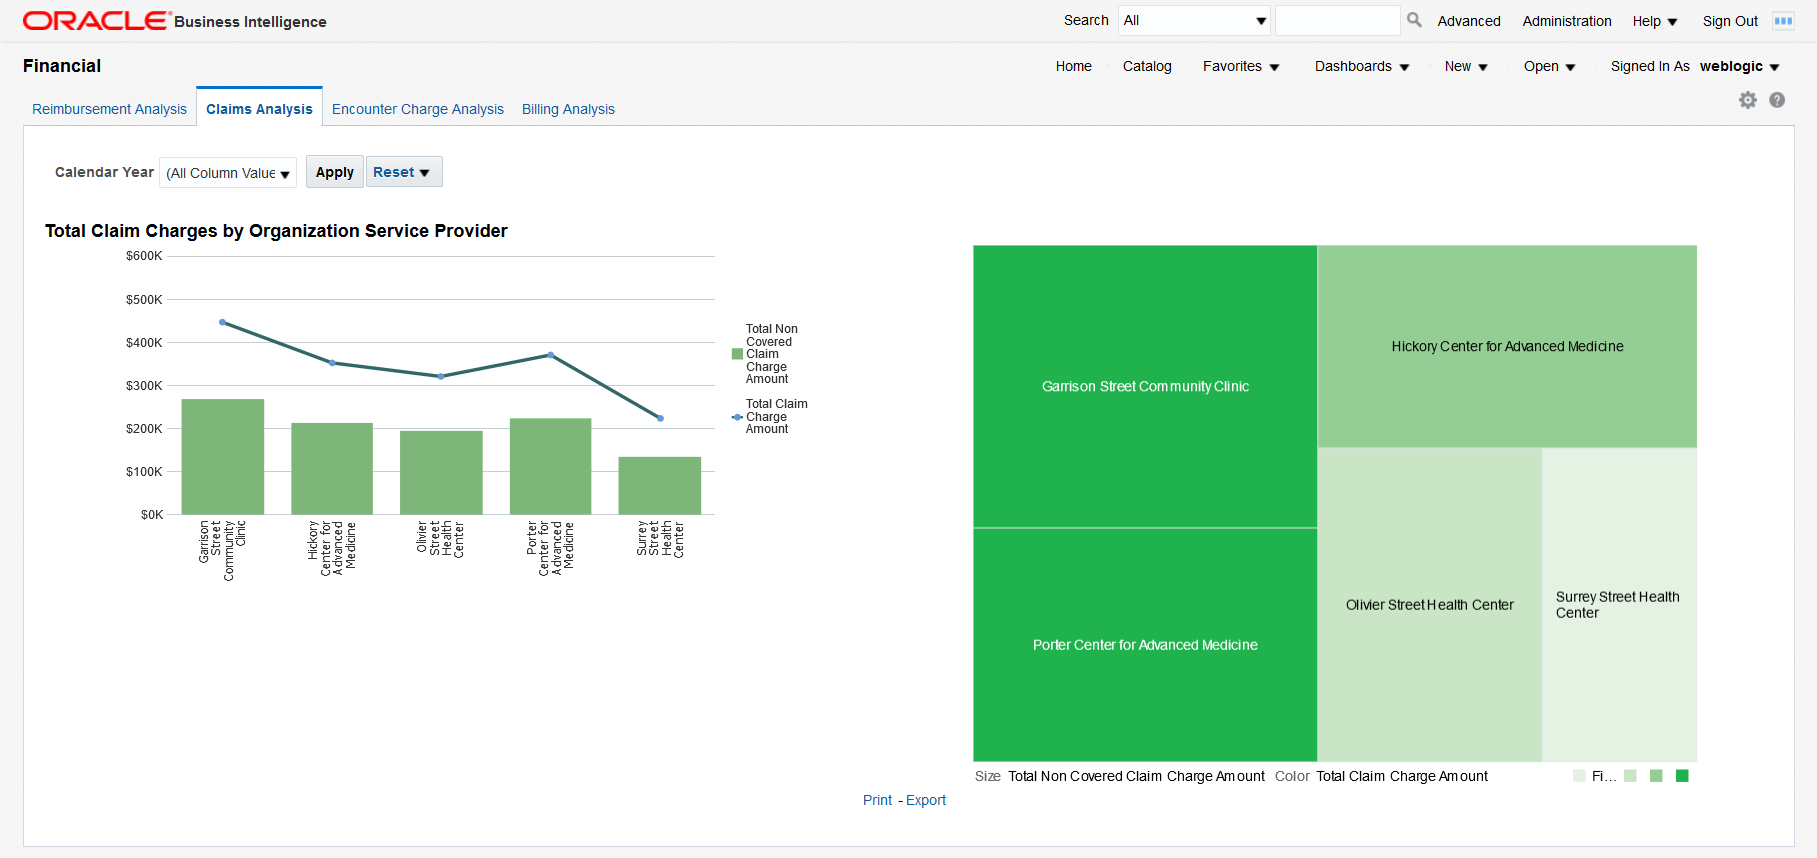
The Claims Analysis page uses the Claim Submission subject area.
Figure 2-13 Claims Analysis Page

You can use the filter at the top of the page to focus on specific calendar years. This page has the following report:
- Total Claim Charges by Organization Service Provider - This report allows you to see
the extent to which the charges claimed by each organization service provider are
covered by insurers and to evaluate the risk of overdue or delinquent payments. The
treemap chart on the right allows you to understand the exposure to the various
service providers based on their relative sizes.
Click on a bar in the graph to display a detailed list of all the claims for that organization. From there, you can click on an MRN to display all the billing details for a patient or you can click on a claim number to display additional details for that claim.
Parent topic: Financial Dashboard
Encounter Charge Analysis
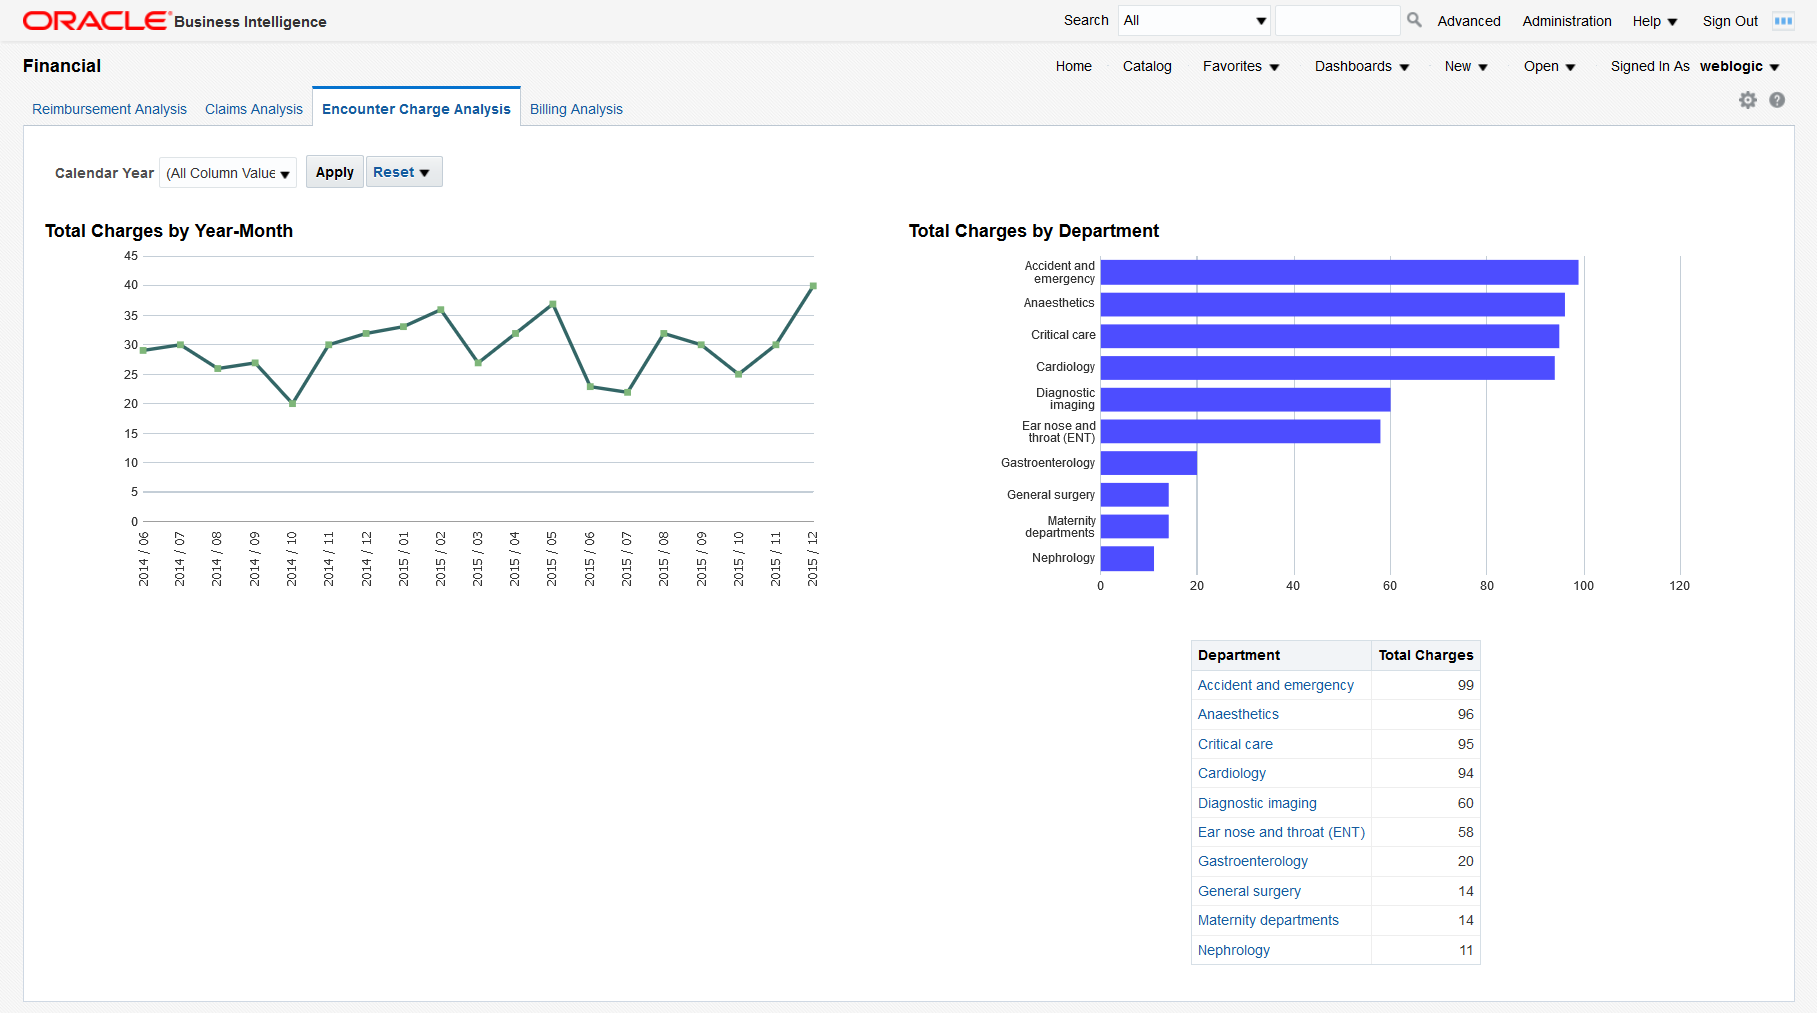
Figure 2-14 Encounter Charge Analysis Page

You can use the filter at the top of the page to focus on specific calendar years. This page has the following reports:
- Total Charges by Year-Month - This report helps you understand the trend in organization spending for patient services over a chosen period of time.
- Total Charges by Department - This report helps you understand the charging
distribution between departments.
Click on a bar in the graph or on a department name in the table to display a detailed list of all the patient charges for that department.
Parent topic: Financial Dashboard
Billing Analysis
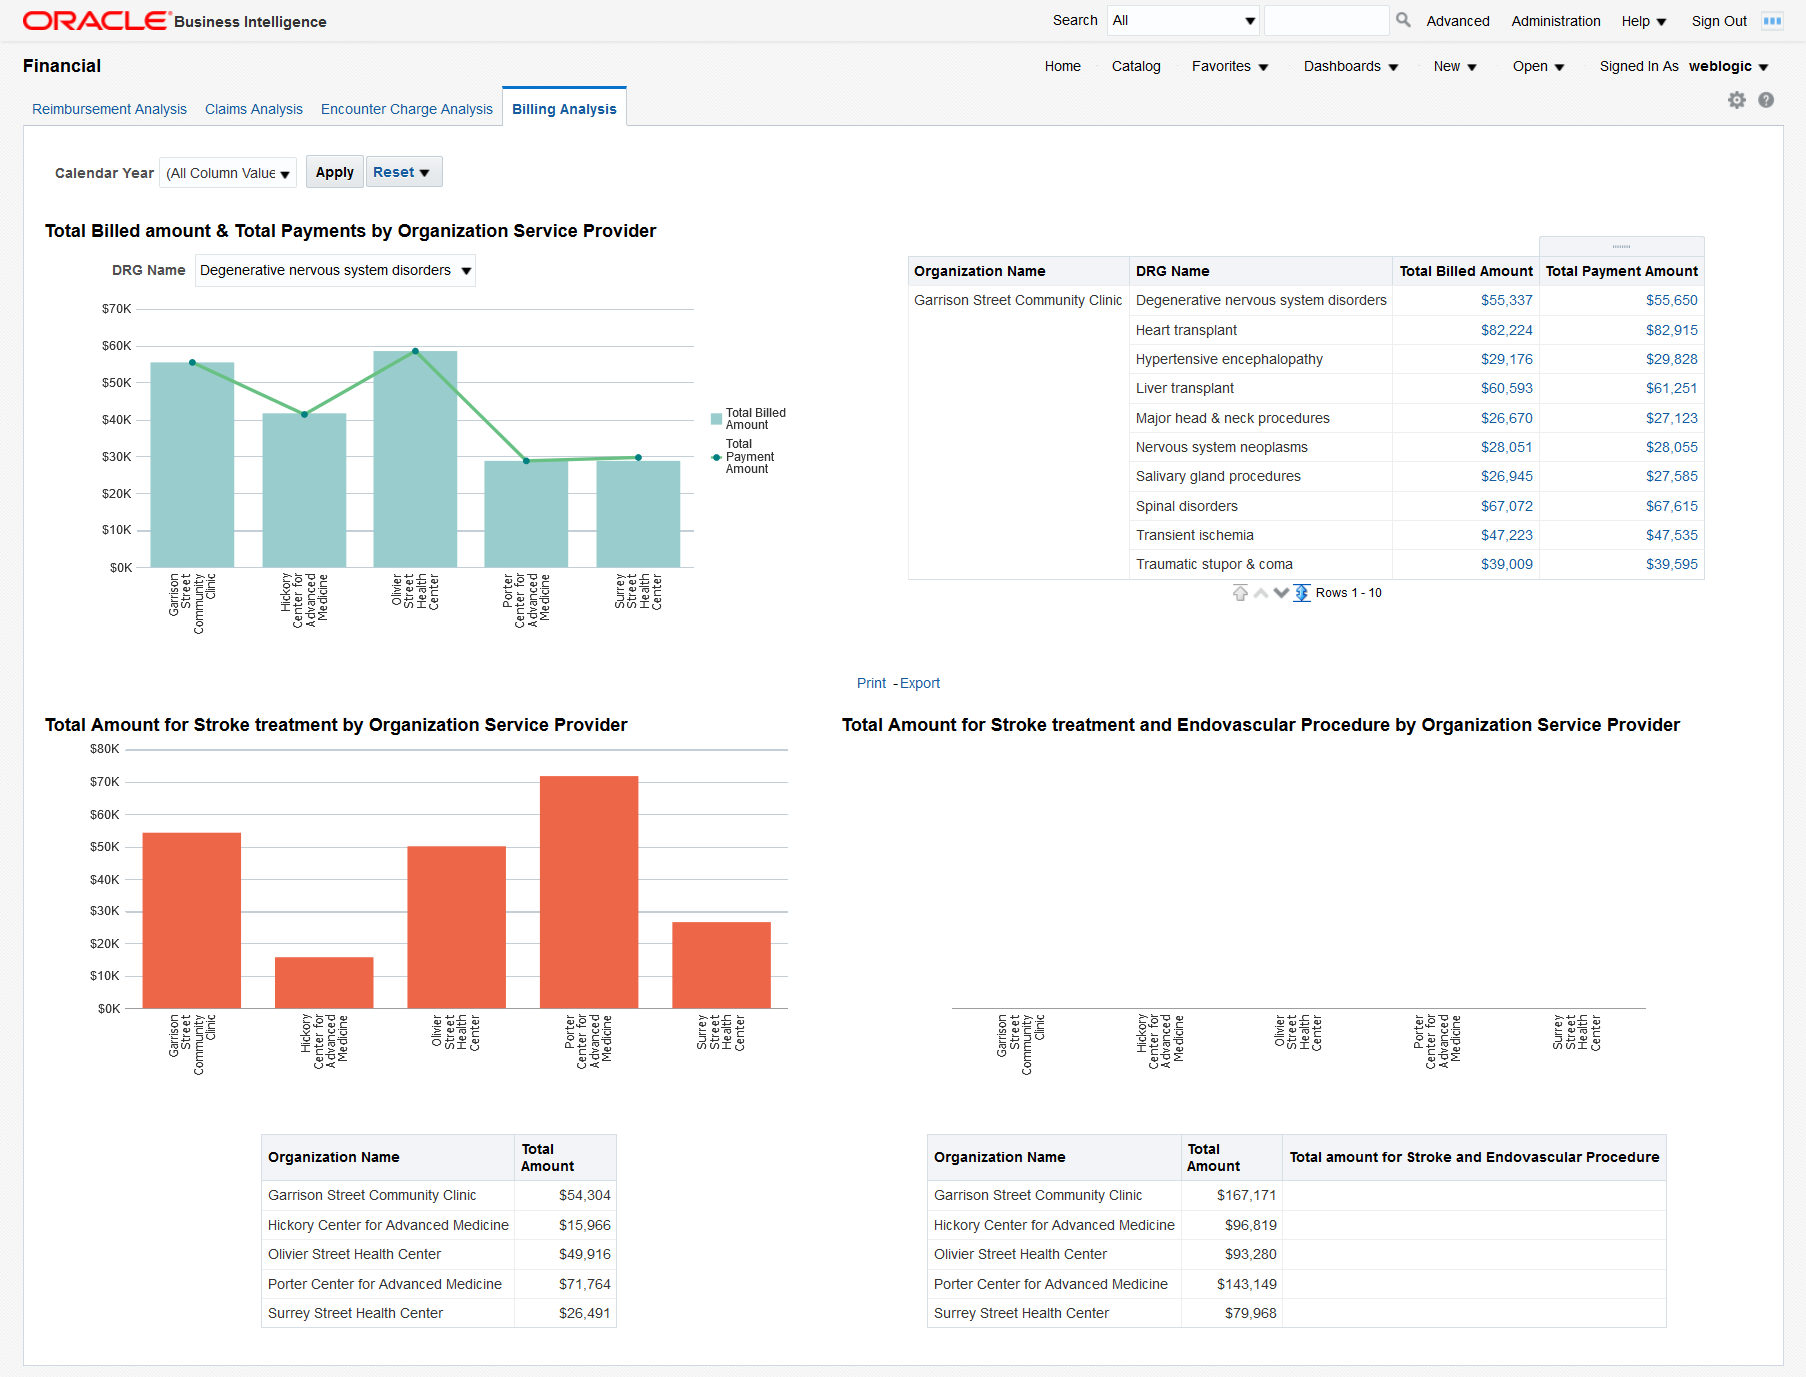
The Billing Analysis page displays comparative billing information for your organizations and detailed bills for individual patients.
Figure 2-15 Billing Analysis Page

You can use the filter at the top of the page to focus on specific calendar years. This page has the following reports:
- Total Billed Amount and Total Payments by Organization Service Provider - Graphical
report and a tabular report showing the total billed amount and the total payment by
organization filtered by DRG. This report helps you identify costs and payments for
patient services specific to each organization based on diagnosis-related groups.
Click on a bar in the graph or on a total billed or payment amount to display a detailed list of all the bills for that DRG for the selected organization. From there, you can further drill down the details of a specific bill by clicking on a bill number.
- Total Amount for Stroke Treatment by Organization Service Provider - You can modify this report to use any diagnosis or procedure. This report helps you compare the costs that organization service providers spend on stroke treatments.
- Total Amount for Stroke Treatment and Endovascular Procedure by Organization Service Provider - This report helps you compare the costs that organization service providers spend on stroke treatments and endovascular procedures.
Parent topic: Financial Dashboard