View circular genomic data
- On the left, click the Circular Genomic Viewer tab. Select a
Patient ID or Subject ID.
If an ID is selected in the View Record tab, it's inherited in the Circular Genomic Viewer tab.
- To filter your view, you can select a Specimen Type or an Anatomical Site. The DNA Reference Version selected is used to filter out the results and determine the cytoband to be used while rendering the circular genomic plot for any of the five data types.
- Select an Assembly Version.
- Click Submit.
- Select only one specimen of different result types to plot the graph. By default, the cytoband of chromosomes is also plotted which is the outer most ring of the circular plot.
- Click Plot Graph.
Note:
For the circular viewer to run properly in IE9, turn off compatibility mode.
About the Circular Genomic Viewer
Circular genomic data viewer provides an interface for you to visualize the genomic data which includes variation, micro array expression, copy number variation, dual channel expression and RNA sequencing. The system uses the VisQuick tool, which is a Javascript library built specifically for genomic data visualization.
For more information, see:
Parent topic: View data of a single patient or subject
Select data to plot
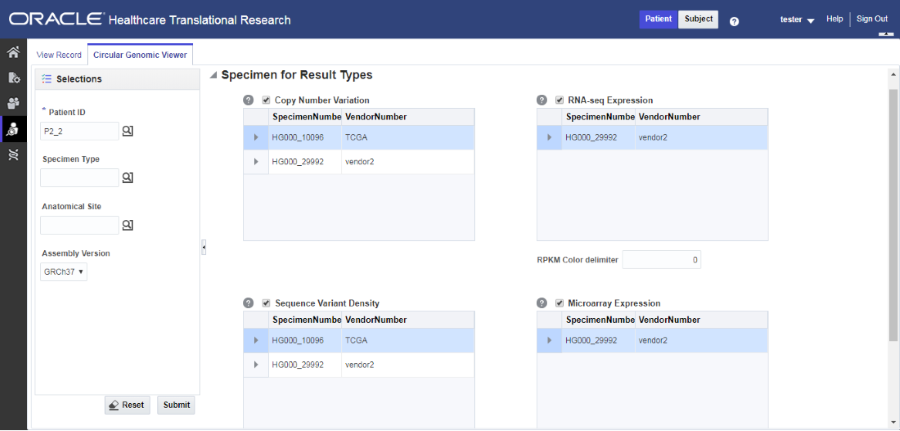
Figure 4-1 Selecting data to plot for the Circular Genomic Viewer

For more information, see:
- Microarray Expression
- Sequencing-Variant Density
- RNA-Seq Expression
- Copy Number Variation
- Dual Channel Microarray Expression
Parent topic: View circular genomic data
Microarray Expression
The microarray expression panel displays all the specimens of the result type expression. You can select only one specimen at a time.
For the selected specimen from the panel, you can view the list of hybridizations available for that specimen. You can select a maximum of two hybridizations from the multiple choice box, for which the plot is rendered.
The color delimiter value is used to render color to the data points in the plot based on the intensity value. If the intensity value is above the value defined in color delimiter then the data points have green color Otherwise, the points have red color.
Parent topic: Select data to plot
Sequencing-Variant Density
This option enables you to plot the density of variants for every 100-kb region for a specimen. The sequence variant density panel displays all the specimens of the result type sequence variants. You can select only one specimen at a time.
Parent topic: Select data to plot
RNA-Seq Expression
This panel displays all the specimens of result type RNA Sequencing. Each level of normalization like Gene, Exon and Transcript appears as separate panel. You can select one specimen from each normalization level to view the plot. You also need to select a normalization metrics as RPKM, TPM, FPKM, or FPKM_UQ.
The color delimiter value is used to render color to the data points in the plot based on the normalization metrics value. For example, if the RPKM value is above the value defined in color delimiter then the data points have green color. Otherwise, the points have red color.
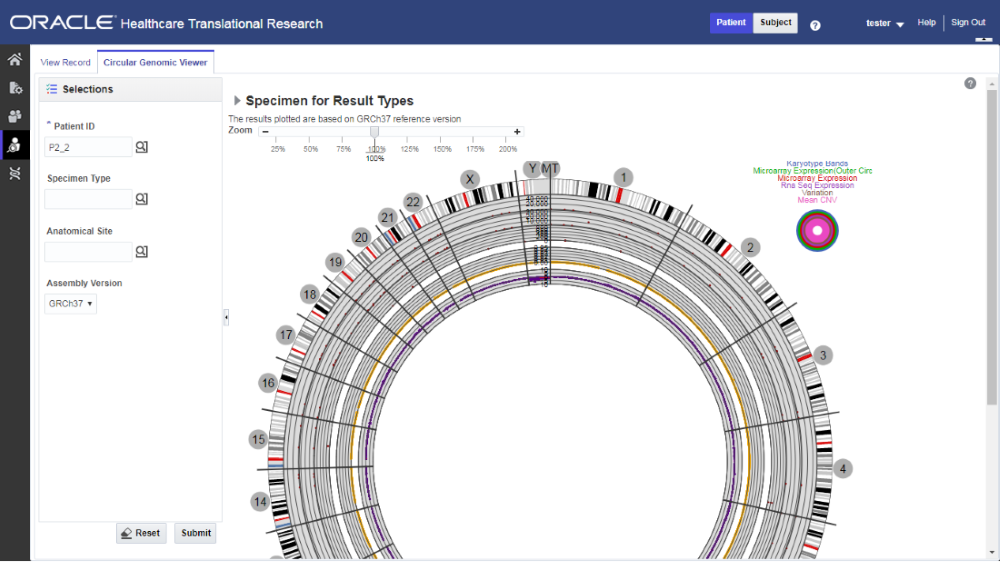
You can use the check boxes provided next to each of the result types to determine if the specimen selected is plotted or not. You can select one or all of the result types for plotting of the graph. Once the specimens are selected, the circular genomic plot is displayed. The outermost circle in the plot is the Cytoband. The supported Cytoband versions are: hg-18 and hg-19.
Note:
To display the cytoband in the Circular Genomic plot we need an entry mapping each DNA Reference Version to the Cytoband in the TRC_LOOKUP_CODE table in the APP_schema.For each reference version we must insert a row with the following values:
- CODE_TYPE: TRC_REFVERSION_CYTOBAND
- CODE:cytobandHG19 (for HG19), cytobandHG18 (for HG18), or cytobandHG38 (for HG38)
- CODE_NAME: Name of the loaded DNA reference version (for example, V69)
You can hover over the plot to get details such as:
- Microarray Expression: Chromosome, Start Position, End Position, Value and Gene
- Copy Number Variation: Chromosome, Start Position, End Position and Value
- Sequence Variants: Chromosome, start position, end position, and value. The density value is calculated by: Total number of variants for 100kb region / 100000
- Dual Channel Microarray Expression: Chromosome, Start Position, End Position, Value and Gene
- Rna Seq Expression: Chromosome, Start Position, End Position, Value and Gene
Parent topic: Select data to plot
Copy Number Variation
The panel displays all the specimens of the result type copy number variation. You can select only one specimen at a time.
The value for copy number variation depends on the CNV result type selected. If the selected specimen contains data from Genome_Wide_SNP_6 array, then the value for CNV is taken from segment mean stored in the database. If the selected specimen has data from complete genomics, then the value is calculated based on the called Ploidy value stored in the database. The value to be plotted is calculated using the following formula for CNV data from complete genomics:
log2(called_ploidy/expected_ploidy)
where,
expected_ploidy is 2 for chr1-22
expected_ploidy is 2 for chrX for females.
expected_ploidy is 1 for chrX outside the pseudo-autosomal region in males
expected_ploidy is 2 for chrX inside pseudo-autosomal region in males
The pseudo autosomal regions on chrX for 'NCBI build 37' as reported by Complete Genomic are 60000 - 2,699,519 and 154,931,043 - 155,260,559.
The pseudo autosomal regions on chrX for 'NCBI build 36' as reported by Complete Genomic are 0 -2,709,519 and 154,584,237 - 154,913,753.
For called_ploidy zero, the log2 should be infinity, in which cases the final value is taken as -2.
Parent topic: Select data to plot
Dual Channel Microarray Expression
This panel displays all the specimens of result type Dual Channel Microarray expression. You can select only one specimen at a time.
The color delimiter value is used to render color to the data points in the plot based on the Log2Ratio value. If the Log2Ratio value is above the value defined in color delimiter, then the data points have green color. Otherwise, the points have red color.
Here is how the graph looks.
Figure 4-2 How genomic data is visualized in the Circular Genomic Viewer

Parent topic: Select data to plot