View cohort reports
The Cohort Reports tab lets you view various cohort reports.
Note:
In the Active Query mode, if no filters have been selected in Cohort Query, then the reports display data for only the first 10,000 patients or subjects. This limit is configurable and can be changed using the DEFAULT_ACTIVE_QUERY_LIMIT property in the TRC.properties file.
However, irrespective of the patient or subject selection option, if the count exceeds the value specified in GENOMIC.REPORTS_MAX_PATIENT_COUNT of TRC.properties file, a warning message is displayed. You can either continue to plot with a large number of patients or subjects (might impact performance) or change the selected cohort to a smaller number.
For more information, see:
Parent topic: View and maintain cohorts
View demographic reports
- Along the top, click the Cohort Reports tab.
- On the left, click the Patients or Subjects section, and select a source for your reports, if needed.
- Click Demographic Reports.
- Select the check boxes for the data you want displayed in your list.
- Click Submit.
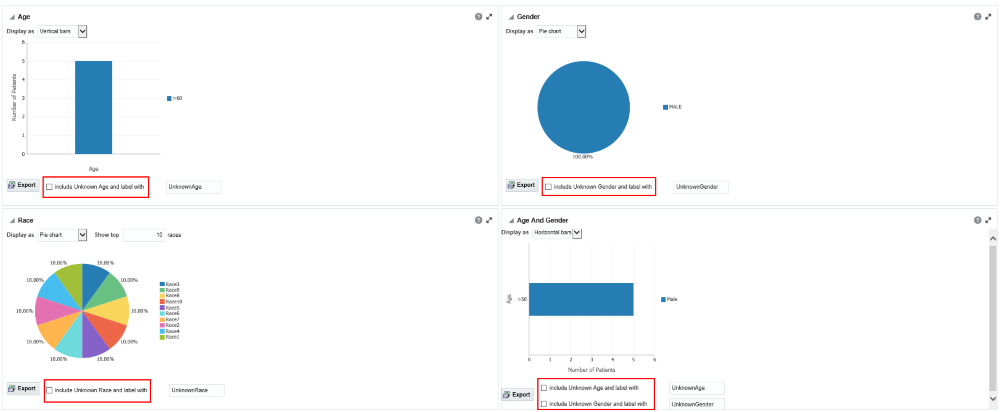
Figure 3-6 Demographic reports in OHTR
For more information, see:
Parent topic: View cohort reports
Handle unknown data
If any missing or unknown data is present, a check box is provided at the bottom of each graph to include missing or unknown data.
For the Age, Gender and Race graphs, if the check box is selected, the graph is refreshed with the unknown data. In this case, unknown data refers to age, gender or race details that are not defined for a particular patient.
For the Age and Gender graph, the unknown age for different genders is combined into one group and the known age is in another group. Both groups are shown in the graph.
Parent topic: View demographic reports
View clinical reports
- Along the top, click the Cohort Reports tab.
- On the left, click the Patients or Subjects section, and select a source for your reports, if needed.
- Click Clinical Reports.
- Select the Specimen Available check box.
- Click Submit.
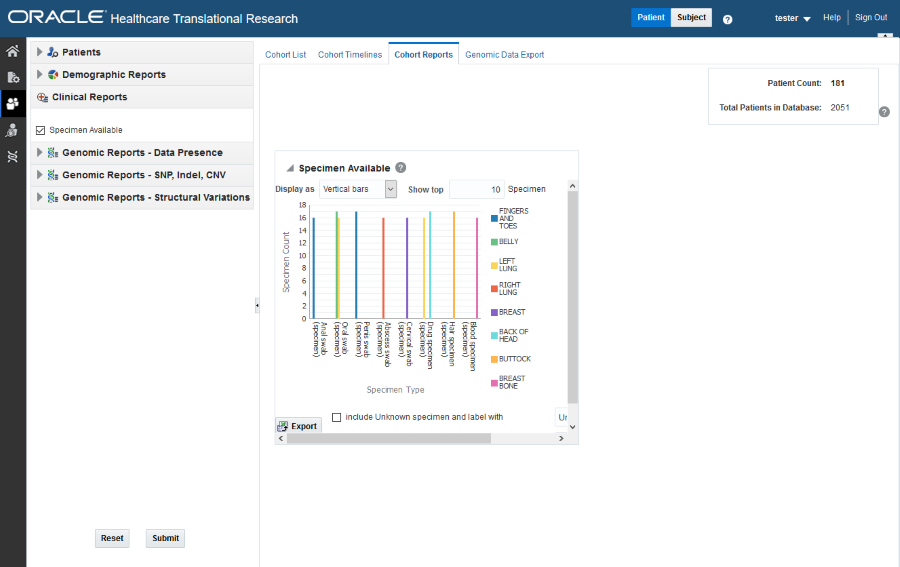
Figure 3-7 A clinical report in Oracle Healthcare Translational Research
For more information, see:
Parent topic: View cohort reports
Handle Unknown Data
If any missing or unknown data is present, a check box is provided at the bottom of each graph to include missing or unknown data.
If Include Unknown Specimen and Label With or Include Unknown Anatomical site and Label With are selected, the graph is refreshed with the unknown data. In this case, unknown data refers to the specimen and anatomical site data that is not defined for a particular patient.
Parent topic: View clinical reports
View genomic reports
In this section you will learn how to:
Parent topic: View cohort reports
View genomic data presence reports
Tip:
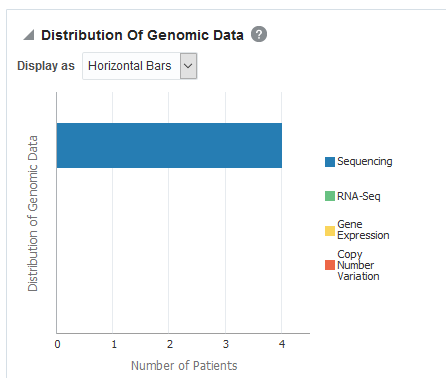
To change the display type after generating the report, select the display option from the Display as drop-down list.To view a breakup of present genomic data by data type, click View distribution of genomic data.
To export the graphical plot type as a PNG image, and the table type as an Excel
spreadsheet, click the Export button(![]() ) for every graphic.
) for every graphic.
Figure 3-8 A Genomic Data Presence report in Oracle Healthcare Translational Research
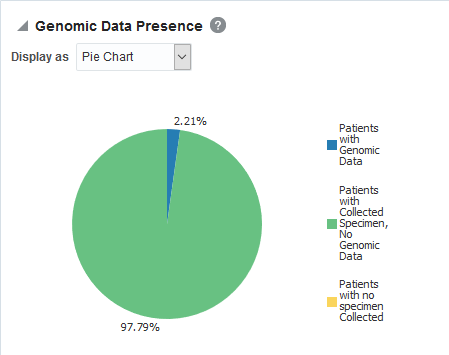
Figure 3-9 Distribution of Genomic Data in Oracle Healthcare Translational Research
Parent topic: View genomic reports
View Genomic Reports - SNP, Indel, CNV
Note:
Genomic Reports SNP, Indel and CNV display the available SNP Indel genomic reports based on the selected cohort of patients or subjects.- Mutated Gene Frequency and Gene Expression
-
To view these reports:
- Along the top, click the Cohort Reports tab.
- On the left, click the Patients or
Subjects section, and select a source for
your reports, if needed.
Note:
There is no upper limit on the number of patients or subjects to be selected. However the performance may slow down as the number of patients or subjects increases. - Click Genomic Report - SNP, Indel, CNV.
- Select the radio button for Gene Level Reports.
- Select Mutated Gene Frequency and Gene
Expression.
Selecting Include All Specimens includes specimens without genomic data. Not selecting this option generates results with genomic data only.
- Enter or search for at least one gene using one of the three search fields: Ad-hoc List, Pathway or Gene Set.
- Expand the Additional Parameters section to add a Specimen Type or an Anatomical Site.
- Click Submit.
You can display the results as horizontal bars, vertical bars, or as a table. To export the bar results into PDF or the table results into Excel, click the Export button (
 ).
).
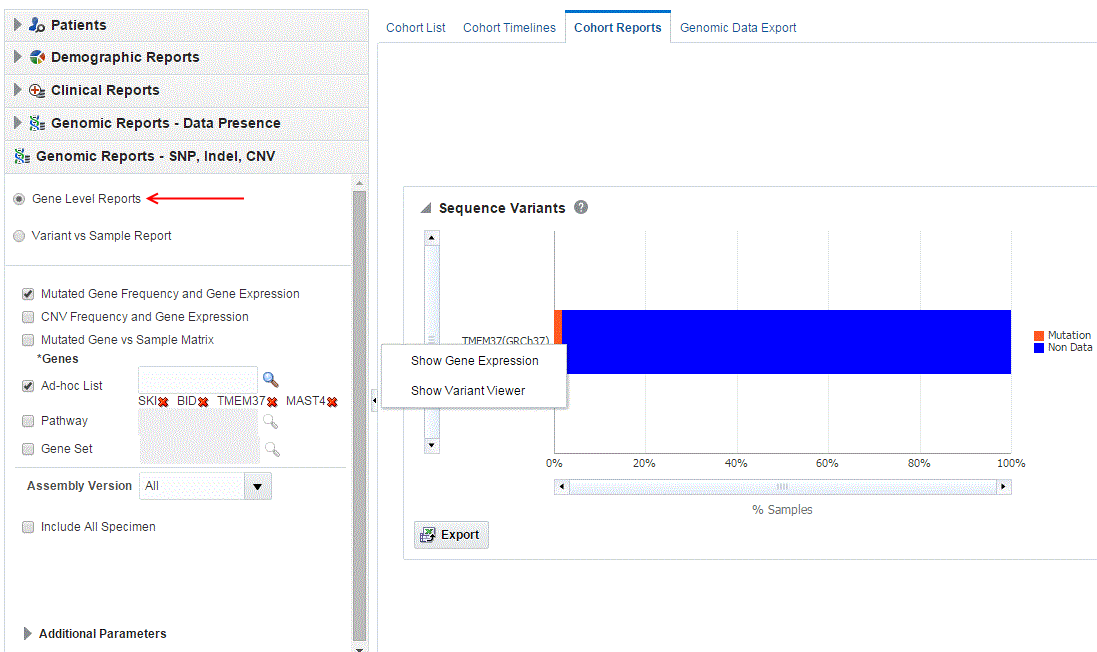
Figure 3-10 A genomic report on Mutated Gene Frequency and Gene Expression
- About the Mutated Gene Frequency and Gene Expression
-
Each bar represents a specimen, which is grouped patient-wise and in the order of the specimen collection date. The Sequence Variants and CNV information for each specimen is displayed. The percentage of specimens with mutation on the gene is also mentioned. Export functionality is provided at each specimen level.
There is a limit to the number of specimens that can be seen in the gene matrix plot. The default value of this parameter is 1000. If the number of specimens in the cohort used for this analysis is greater than the specified value, then the following warning message is displayed:
Figure 3-11 Warning message for reaching a limit on specimens

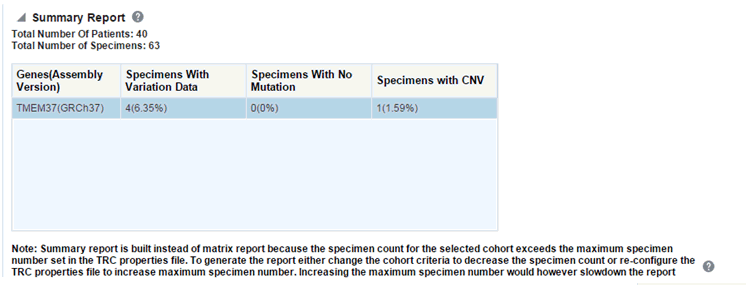
If you continue from this warning message, the report displays the summary statistics instead of the matrix plot. You may have to decrease the cohort size based on some criteria like specimen type or anatomical site or otherwise use cohort query to view the matrix plot. Alternatively, you can also change the default value of MAX_SPEC_REPORT parameter to a desired value and rebuild the plot. However, rebuilding maybe affect the performance of the plot generation.
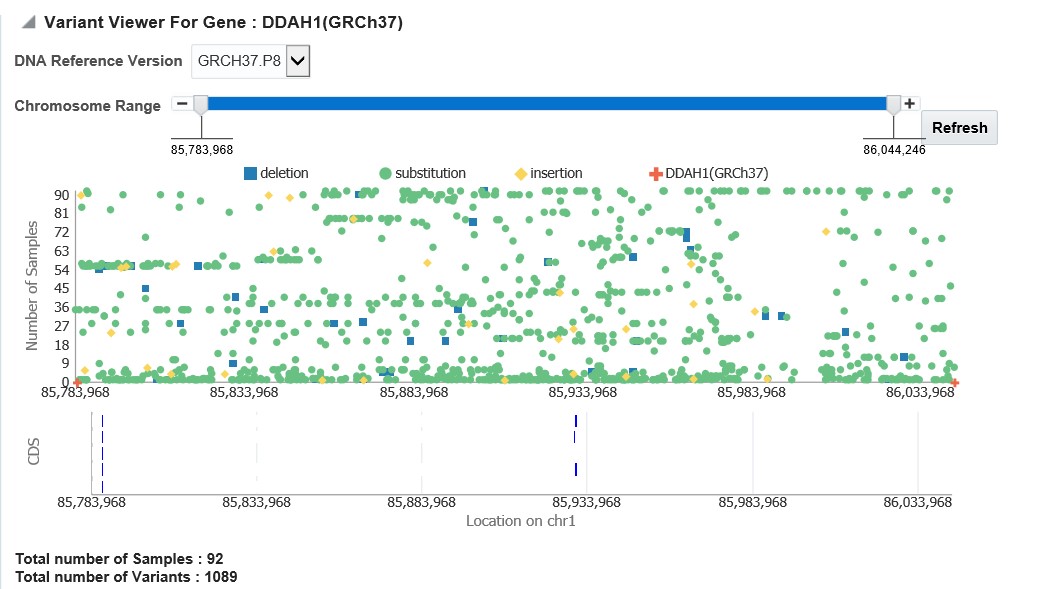
You can further drill down to the sequencing results by clicking "Show Variant Viewer" in Figure 3-10. This will show data in the form of scatter plot depicting variants on the chromosome (Figure 3-12). This drilldown also shows all the variants in tablular format with reference information below the plot.
Figure 3-12 Scatter plot of all variants distributed on the chromosome for the selected gene
- Copy Number Variation Frequency and Gene Expression
-
To view these reports:
- Along the top, click the Cohort Reports tab.
- On the left, click the Patients
or Subjects section, and select a source for
your reports, if needed.
Note:
There is no upper limit on the number of patients or subjects to be selected. However the performance may slow down as the number of patients or subjects increases. - Click Genomic Reports - SNP, Indel, CNV.
- Select Gene Level Reports.
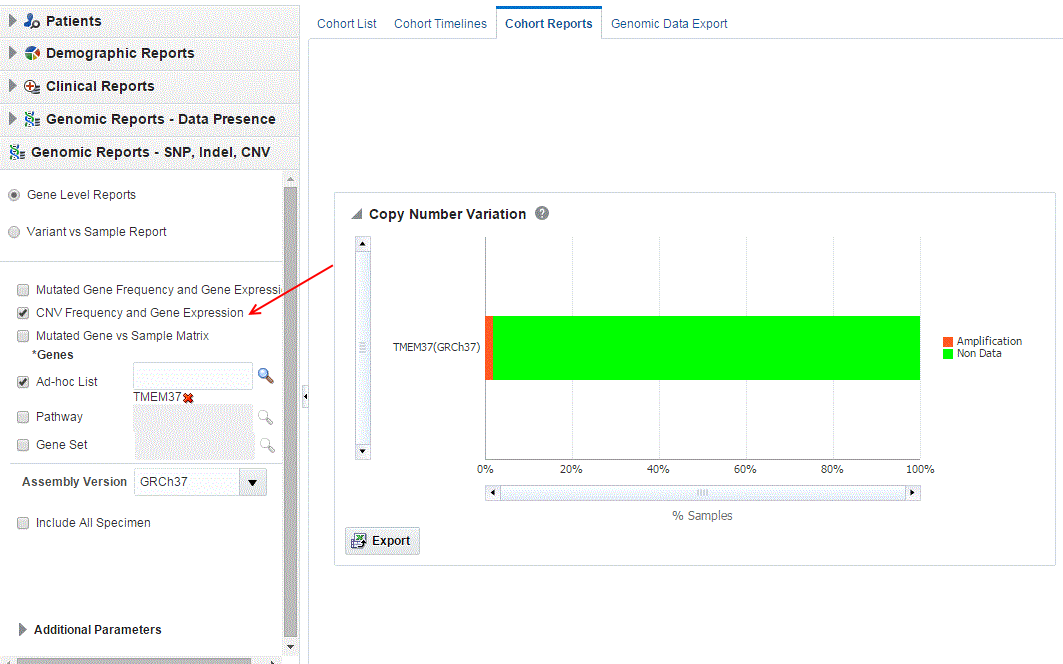
- Select CNV Frequency and Gene
Expression.
Selecting Include All Specimens includes specimens without genomic data. Not selecting this option generates results with genomic data only.
- Enter or search for at least one gene using one of the three search fields: Ad-hoc List, Pathway or Gene Set.
- Expand the Additional Parameters section to add a Specimen Type or an Anatomical Site.
- Click Submit.
Note:
When opening the Excel file, you may receive a warning from Excel stating that the file is in a different format than specified by the file extension. This warning can be safely ignored. For more information, refer tohttp://docs.oracle.com/cd/E23943_01/web.1111/b31973/af_table.htm#autoId34.
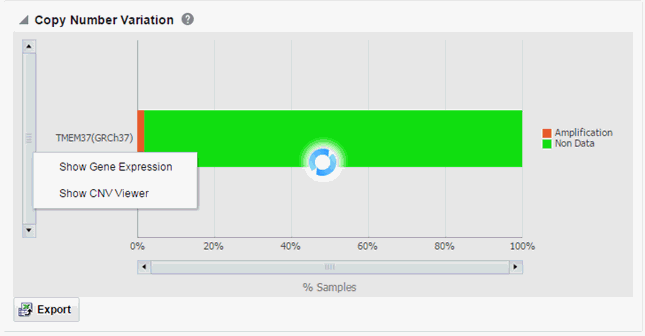
Figure 3-13 A genomic report on Copy Number Variation Frequency and Gene Expression in OHTR
- Mutated Gene vs Sample Matrix
-
Figure 3-15 CNV Sample Details for a selected gene
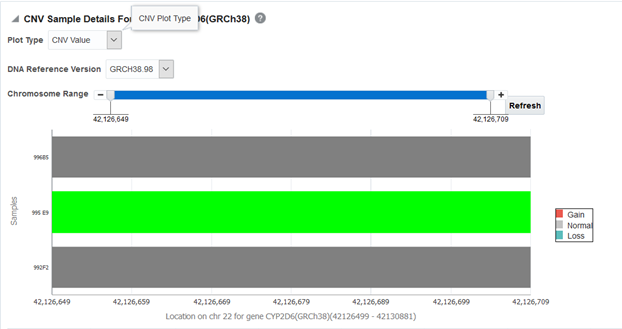
The Plot Type dropdown determines whether CNV Value (default) or Copy Number is shown on the graph.
To view this plot:
- Along the top, click the Cohort Reports tab.
- On the left, click the Patients
or Subjects section, and select a source for
your reports, if needed.
Note:
There is no upper limit on the number of patients or subjects to be selected. However the performance may slow down as the number of patients or subjects increases. - Click Genomic Reports - SNP, Indel, CNV.
- Select Gene Level Reports.
- Select Mutated Gene vs Sample Matrix.
- Enter or search for at least one gene using one of the
three search fields: Ad-hoc List, Pathway or Gene Set.
Selecting Include All Specimens includes specimens without genomic data. Not selecting this option generates results with genomic data only.
- Expand the Additional Parameters section to add a Specimen Type or an Anatomical Site.
- Click Submit.
Note:
When opening the Excel file, you may receive a warning from Excel stating that the file is in a different format than specified by the file extension. This warning can be safely ignored. For more information, refer tohttp://docs.oracle.com/cd/E23943_01/web.1111/b31973/af_table.htm#autoId34.
Figure 3-16 A Mutated Gene Vs. Sample Matrix Report in OHTR

Figure 3-17 A Mutated Gene Vs. Sample Matrix Report ready to be exported

Figure 3-18 A Summary Report for Mutated Gene Vs Sample Matrix Reports
- Variant vs Sample Reports
-
To generate the plot:
- Along the top, click the Cohort Reports tab.
- On the left, click the Patients or
Subjects section, and select a source for
your reports, if needed.
Note:
There is no upper limit on the number of patients or subjects to be selected. However the performance may slow down as the number of patients or subjects increases. - Click Genomic Reports - SNP, Indel, CNV, and select Variant vs Sample Report.
- Enter or search for a Variant ID.
Selecting Include All Specimens includes specimens without genomic data. Not selecting this option generates results with genomic data only.
- Expand the Additional Parameters section to add a Specimen Type or an Anatomical Site.
- Click Submit.
Figure 3-19 A Genomic Variant Vs Sample Report in Oracle Healthcare Translational Research

Figure 3-20 A Genomic Variant Vs Sample Report ready to be exported

Note:
When opening the Excel file, you may receive a warning from Excel stating that the file is in a different format than specified by the file extension. This warning can be safely ignored. For more information, refer tohttp://docs.oracle.com/cd/E23943_01/web.1111/b31973/af_table.htm#autoId34.
Parent topic: View genomic reports
Structural Variations
- Structural Variations in Genes
-
To view the structural variations in genes:
- Along the top, the click Cohort Reports tab.
- On the left, click the Patients
or Subjects section, and select a source for
your reports, if needed.
Note:
There is no upper limit on the number of patients or subjects to be selected. However the performance may slow down as the number of patients or subjects increases. - Click Genomic Reports - Structural Variations and select Structural Variations in Genes.
- Expand the Additional Parameters section to add a Specimen Type or an Anatomical Site.
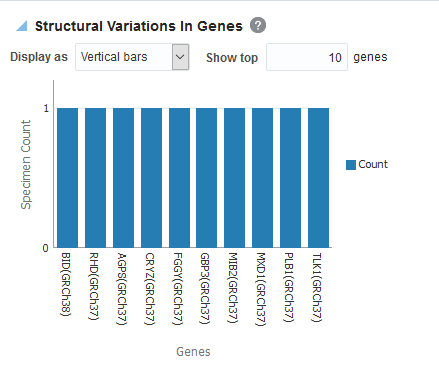
- Click Submit. By default, the top
10 genes are shown and you can increase or decrease the number of
displayed genes.
To export the bar results in PDF or table results in Excel, click Export (
 ).
).
Figure 3-21 A Structural Variations in Genes Report in Oracle Healthcare Translational Research
Note:
When opening the Excel file, you may receive a warning from Excel stating that the file is in a different format than specified by the file extension. This warning can be safely ignored. For more information, refer tohttp://docs.oracle.com/cd/E23943_01/web.1111/b31973/af_table.htm#autoId34. - Structural Variations in Gene Pairs
-
To generate a Structural Variations in Gene Pairs report in Subject context:
- Along the top, click the Cohort Reports tab.
- On the left, click the Patients or
Subjects section, and select a source for
your reports, if needed.
Note:
There is no upper limit on the number of patients or subjects to be selected. However the performance may slow down as the number of patients or subjects increases. - Click Genomic Reports - Structural Variations and select Structural Variations in Gene Pairs.
- Expand the Additional Parameters section to add a Specimen Type or an Anatomical Site.
- Click Submit. By default, top 10 gene pairs
are shown and you can change the default number of bars shown.
To export the bar results in PDF or the table results in Excel, click Export (
 ).
).
Note:
When opening the Excel file, you may receive a warning from Excel stating that the file is in a different format than specified by the file extension. This warning can be safely ignored. For more information, refer tohttp://docs.oracle.com/cd/E23943_01/web.1111/b31973/af_table.htm#autoId34.
Parent topic: View genomic reports
