Formatting graphics
The first decision you need to make about formatting is what kind of graph you want to display. The following chart types are predefined in the InForm application:
To create a... |
Specify this value for the chart type... |
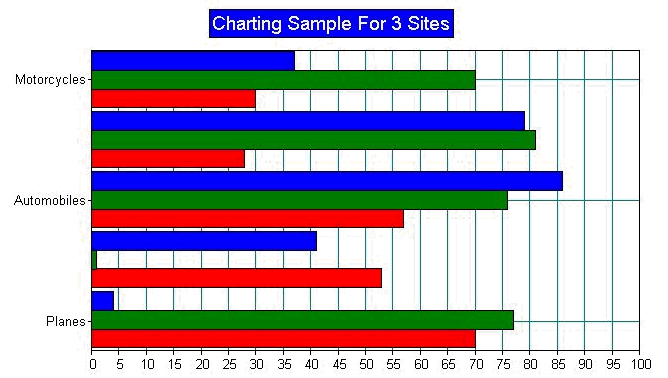
Horizontal bar chart |
&H20000 |
Vertical bar chart |
&H30000 |
Pie chart |
&H40000 |
To determine what type of graph to display, the following statements check for the value of nChartType. If no value is specified, a pie chart is displayed by default.
'Specify the type of graph to display
nChartType = &H40000
If IsEmpty(Request.QueryString("Pie")) or
Request.QueryString("Pie")=0 Then nChartType = &H30000
If Request.QueryString("H")>0 Then nChartType = &H20000
The following figure shows an example of a horizontal bar chart:


