Sizing the display area
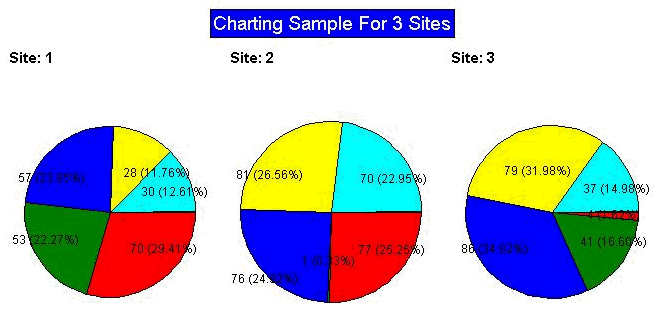
When you produce reports as pie charts, you will want to consider how to space the graphs in the display to make them easy to read. For example, if you want to produce pie charts for several sites, make sure that you allow enough room to display a reasonably sized chart for each site:
'Multiply the number of columns by an arbitrary number of
'pixels to determine column width
If nChartType = &H40000 AND nCols>3 Then
nSize = nCols*300
Else
nSize = 900
End If
The following figure shows three pie charts spaced evenly across the browser window:


