Creating labels and legends
For both pie charts and bar graphs, labels can make the information represented in the graphs easier to understand. The following statements add labels, and a legend explaining them, to a pie chart. Notice that the legend for the pie chart is actually the subtitle for the individual charts. The group labels become the master legend since the grouping belongs to all pies.
obj.AddLegend i, "Site: " & i+1
obj.SetGraphValue 0, i, Int(rnd*100)
obj.SetGraphValue 1, i, Int(rnd*100)
obj.SetGraphValue 2, i, Int(rnd*100)
obj.SetGraphValue 3, i, Int(rnd*100)
obj.SetGraphValue 4, i, Int(rnd*100)
Next
obj.SetGroupLabel "Planes", 0
obj.SetGroupLabel "Trains", 1
obj.SetGroupLabel "Automobiles", 2
obj.SetGroupLabel "Trucks", 3
obj.SetGroupLabel "Motorcycles", 4
'Determine the size of the legend by specifying the position of
'its Left, Top, Right, and Bottom corners, in that order:
x = nSize
obj.SetLegendRect x,x,x+1000,x+1000
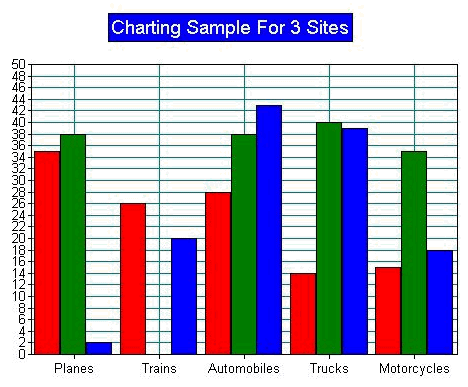
The following figure shows a vertical bar chart with a corresponding legend displayed beneath the chart:


