Sample report: Checked in verses vaccinated
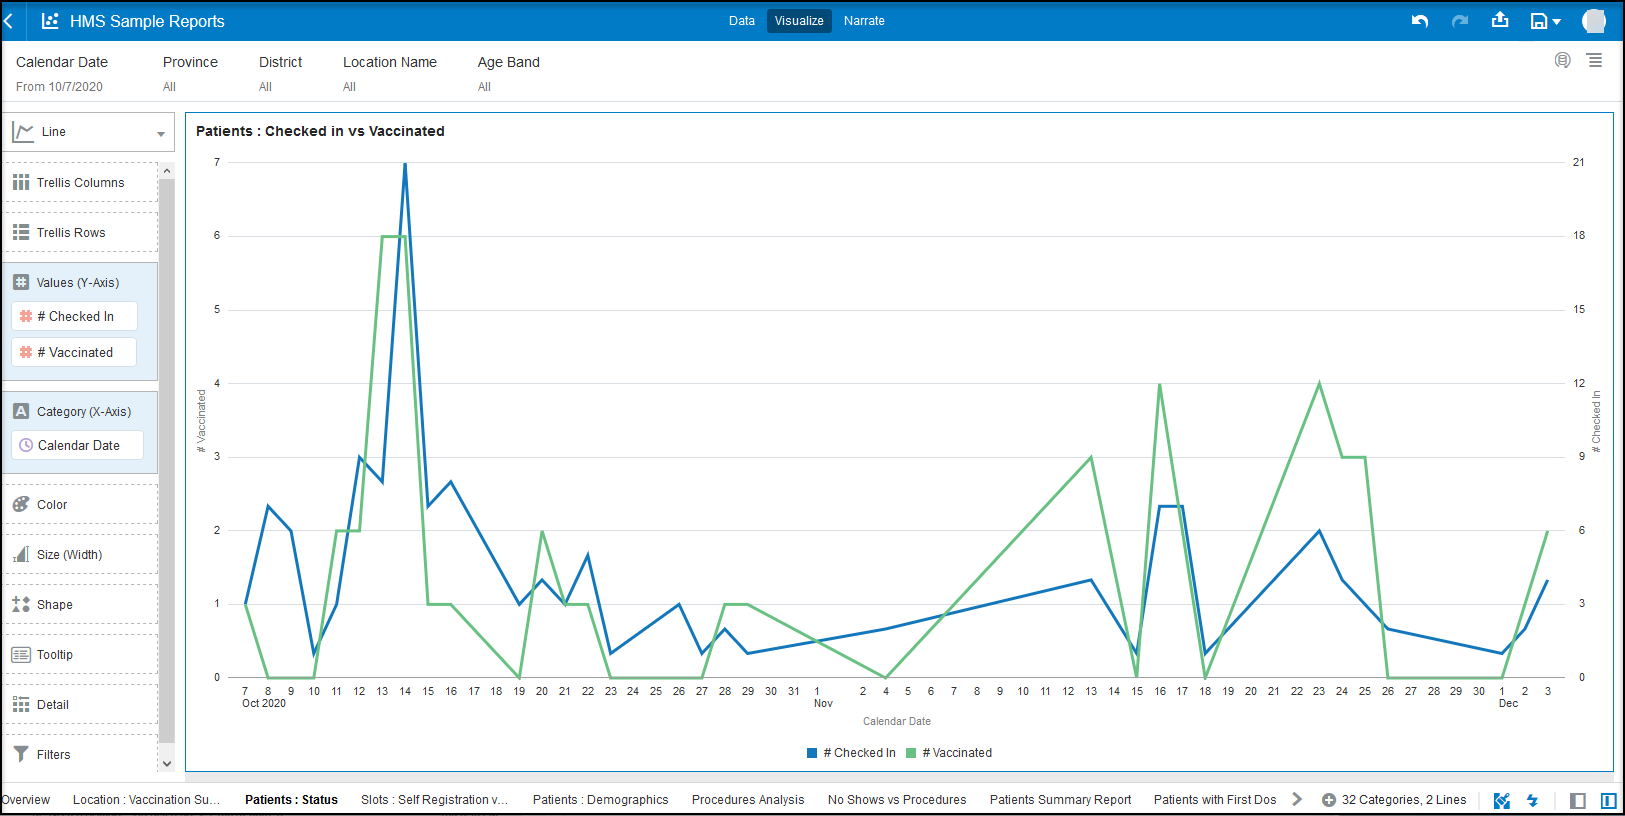
Oracle Analytics contains example reports so you can see how you can visualize Oracle Health Immunization Management data. For example, you may want to create a report to see how many patients checked-in for an appointment and how many had their appointments completed (for example, patient vaccinated).
After accessing the sample reports from a Shared Folder, you can
select the different tabs from the bottom row to review different types of
data. The following report shows the number of checked-in patients in blue
and the number of vaccinated patients (completed appointments) in green
during October, November, and part of December. The top tabs allow you to
change the view. For example, you can select the Calendar
Date tab from the top to change the date range. You can
hover over the data points to see the exact number checked in or vaccinated
with the full date.
Note:
Oracle Analytics does not save any changes you make to the view. After you close the report, it reverts back to the original sample data view.
Parent topic: Sample Reports