About Smart Profiles
Overview
With SMART Profiles you can efficiently manage and resolve Suspended Profiles resulting in improved data accuracy and reliability within OPERA Cloud Central. This applies only when OPERA Cloud Central is connected to a Property Management System (PMS) through Cloud Hub.
Profiles are suspended in OPERA Cloud Central for two primary reasons:
- Invalid: Profiles that fail to meet validation criteria due to incorrect or missing information are suspended as INVALID. This ensures that only accurate and complete data is processed and retained.
- Matches Found: Profiles that are identified as potential matches to an existing profile in OPERA Cloud Central are suspended as MATCHES FOUND. This allows you to review and manage duplicate profiles.
Summary
The SMART Profiles summary screen provides a summary of data categorized as either Invalid or Matches Found, based on records inserted on the same day (Today), or the total number of records currently in the staging area.
The summary screen also displays the count of unique invalid profile types or issues detected. Clickable areas allow you to view a filtered list based on the selected errors.

Invalid Profiles
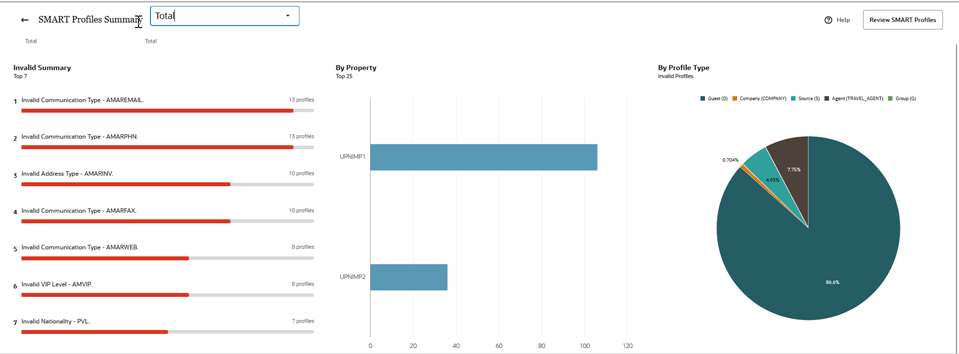
- Invalid Summary: The horizontal bar chart displays the top 7 most frequent profile validation issues, ranked by their frequency of occurrence. The most common errors appear at the top, sorted by frequency. Each bar represents a specific validation error or data issue, such as an invalid nationality or communication type, with the count indicating the total number of profiles affected by that particular issue.
- By Property: A vertical bar chart displays the number of invalid profiles grouped by property, with each bar representing a property sorted in descending order based on error count. Up to 25 properties are shown at a time, with an option to navigate to the next set of 25 properties.
- By Profile Type: A pie chart shows the distribution of invalid profiles by profile type (e.g., Guest, Company). Each segment represents the percentage of total invalid profiles attributed to that profile type.
Matching Profiles
Shows the total number of incoming profiles with matches found. You can click on areas of the screen to navigate to a filtered list based on your selection.

-
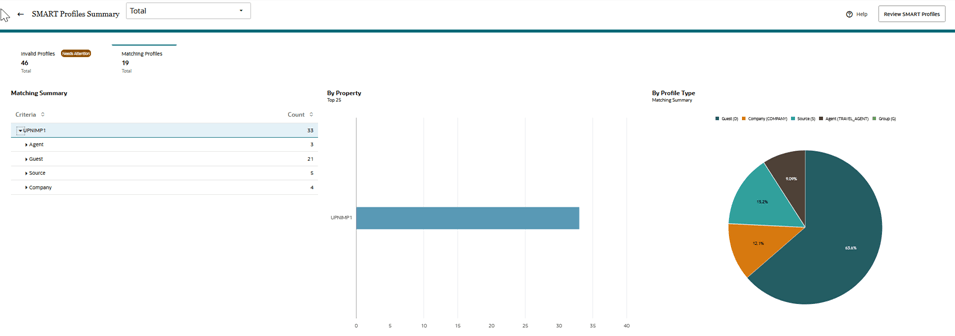
Matching Summary Table: This expandable table presents matches grouped by property, profile type, and matching criteria. Each row indicates the matching rule used (e.g., phone, email) and the number of profiles that matched under that rule.
-
By Property: The bar chart provides a horizontal view of the distribution of matching profiles across multiple properties. Each bar represents a property, with its length indicating the total number of profiles that have one or more potential duplicate matches. The chart displays up to 25 properties at a time, with an option to navigate to the next set of 25 properties.
-
By Profile Type: The pie chart illustrates the distribution of matching profiles by profile type, including Guest, Company, and others. Each segment of the chart represents a distinct profile type, with the size of the segment indicating the percentage of total matching profiles within that category. This visual representation provides a clear summary of how matches are distributed among various profile types.
Parent topic: Profiles