3 Account Metrics
Workbook synopsis
This workbook provides a dashboard view of studies, sites, and users in Oracle Site Activate, as well as detailed cross-tab sheets of each.
Dashboards and sheets
Studies dashboard
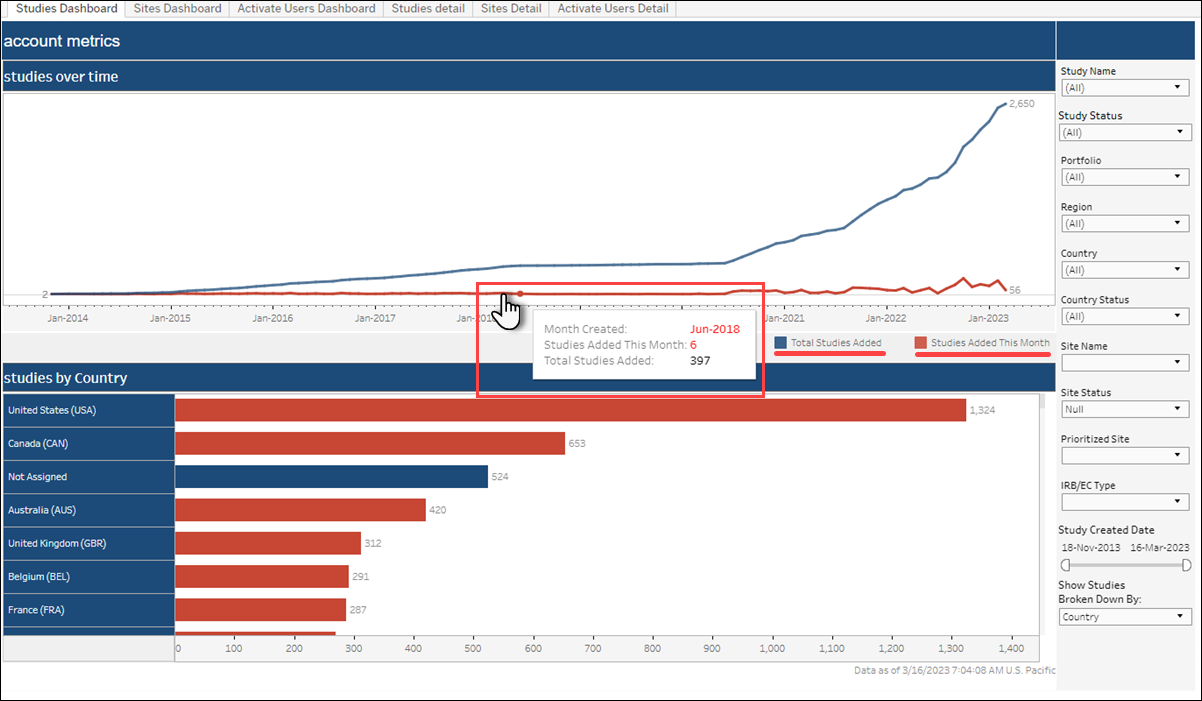
The Studies Dashboard shows:
- Number of studies added to Oracle Site Activate over time
- Breakdown of studies by different criteria (Country, Protocol number, etc.)
Notes:
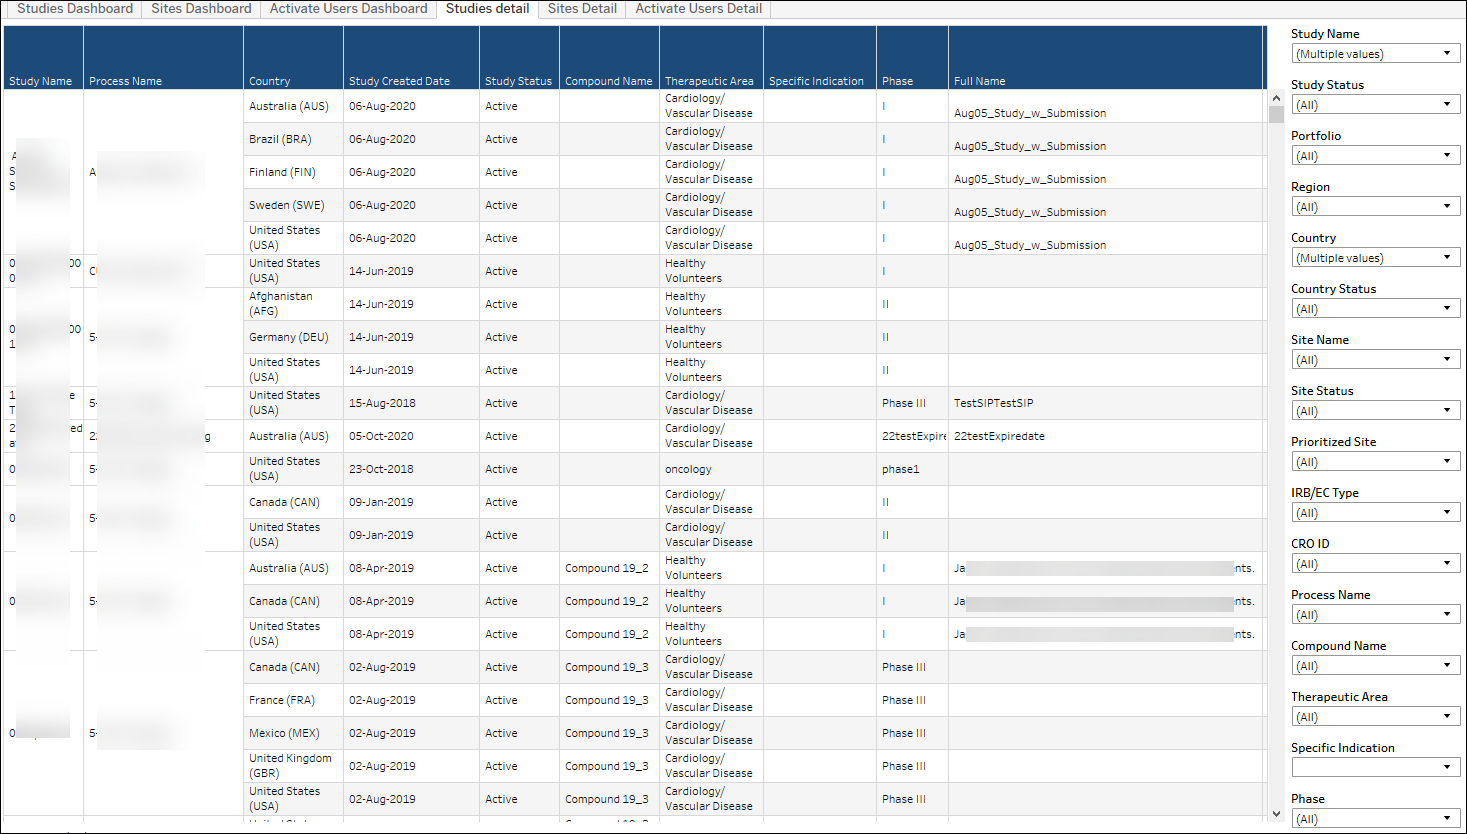
- You can view the study detail on the "Studies Detail" worksheet of this workbook. This worksheet provides filters (e.g., Study Name, Therapeutic Area, Phase, etc.) you can use to subset the data in the detail worksheet.
- Click a line graph on the Studies Dashboard to navigate to the Studies Detail sheet and see all the studies created in the selected month.
- If there were no studies created for a particular period, you will not see data for that period in the dashboard.
- You can view studies broken down by different attributes captured in Oracle Site Activate, such as Region, Country, Therapeutic Area, etc., as well as by custom flex string values.
Studies Dashboard sheet
Studies Detail sheet
Sites Dashboard
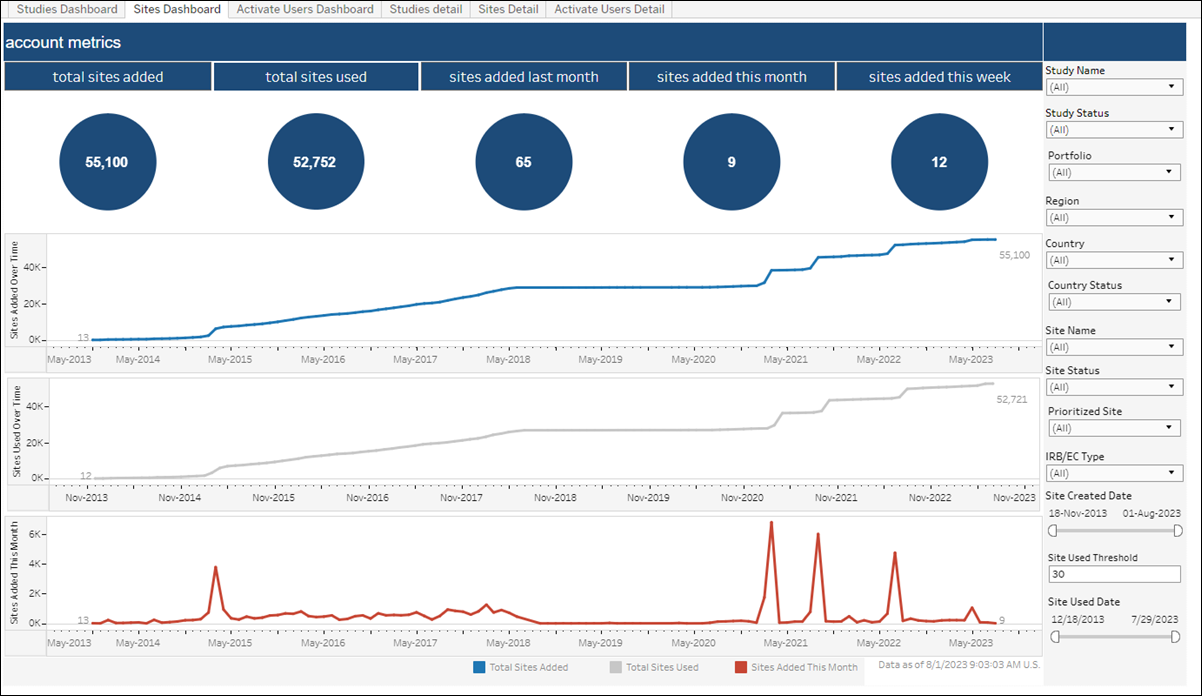
The Sites Dashboard shows KPIs for:
- Total sites added
- Total sites used
- Sites added last month
- Sites added this month
- Sites added this week
Below the KPIs, you'll find line graphs for Sites Added Over Time, Sites Used Over Time, and Sites Added This Month. Hover over any point on the graphs to see additional details. You can also use the Site Created Date filter, in the filter panel to the right, to control the range of the line graphs.
You can also use the Site Used Date filter in the right side panel to filter the report’s Total Sites Used KPI and Sites Used Over Time graph to a specific date range based on when a site is marked as used. The site used date is the earliest of IP release status date, Activated status date, and In activation status + threshold days.
Site used criteria are:
- Site has been in In activation status for longer than 30 days accumulatively
- OR site is IP released status
- OR site is in Activated status
30 days is the default value of the in activation threshold for a site to be considered used and it can be adjusted to any other numbers as needed.
Additional notes:
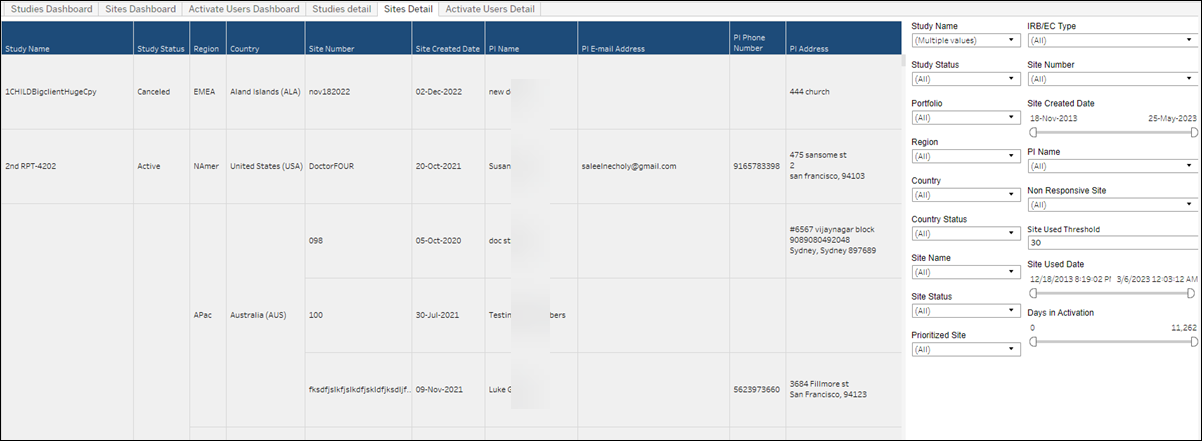
- You can view the site detail on the "Sites Detail" worksheet of this workbook. This worksheet provides filters (e.g., Study Name, Site Number, etc.) you can use to subset the data in the detail worksheet.
- If there were no sites created for a particular period, you will not see data for that period in the dashboard.
- Click a line graph on the Studies Dashboard to navigate to the Studies Detail sheet and see all the studies created in the selected month.
Sites Dashboard sheet
Sites Detail sheet
Activate Users Dashboard
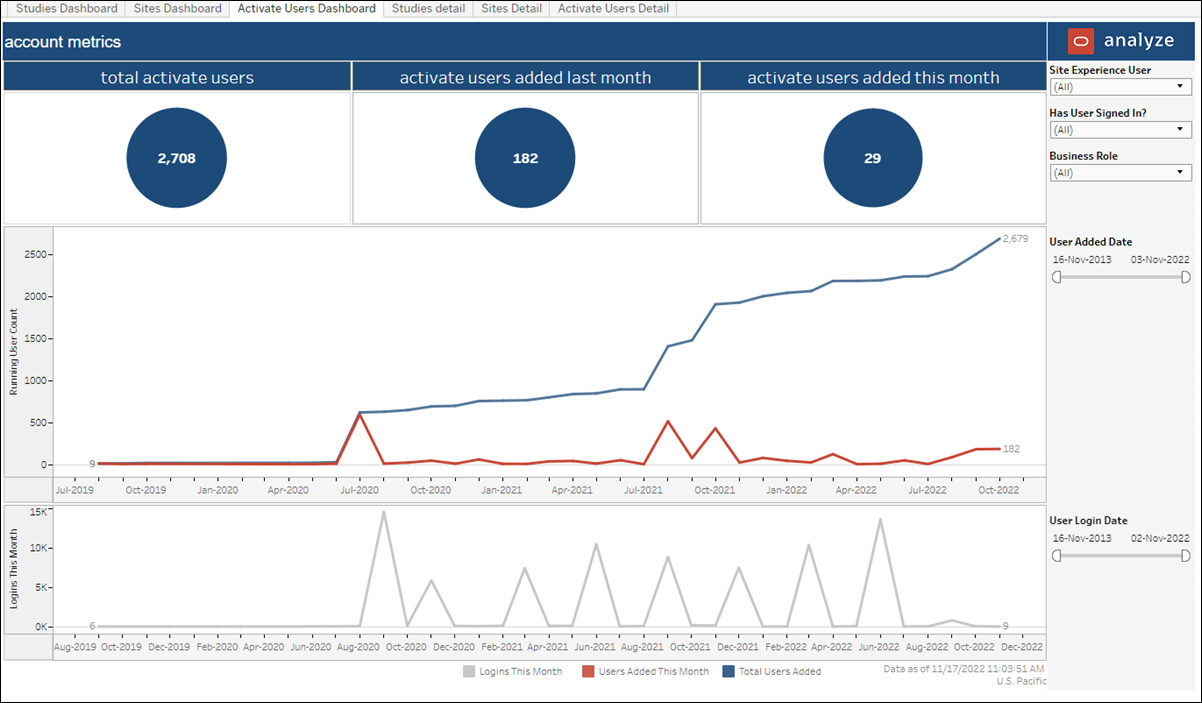
This dashboard shows KPIs for:
- Total number of users (excluding Oracle users)
- Total number of users added last month (excluding Oracle users)
- Total number of users added this month (excluding Oracle users)
The sheet also includes two line graphs:
- User Added – Graph lines represent Users Added This Month and Total Users Added. You can hover over any point on the graph lines to see the month, total users added for that month, and total users added. You can also adjust the graph timespan with the "User Added Date" filter to the right of the graph.
- User Logins – This graph line indicates logins for users in the account. Hover over any point on the graph lines to see the month, logins for that month, and distinct users that logged in that month. You can also adjust the graph timespan with the "User Login Date" filter to the right of the graph.
Notes:
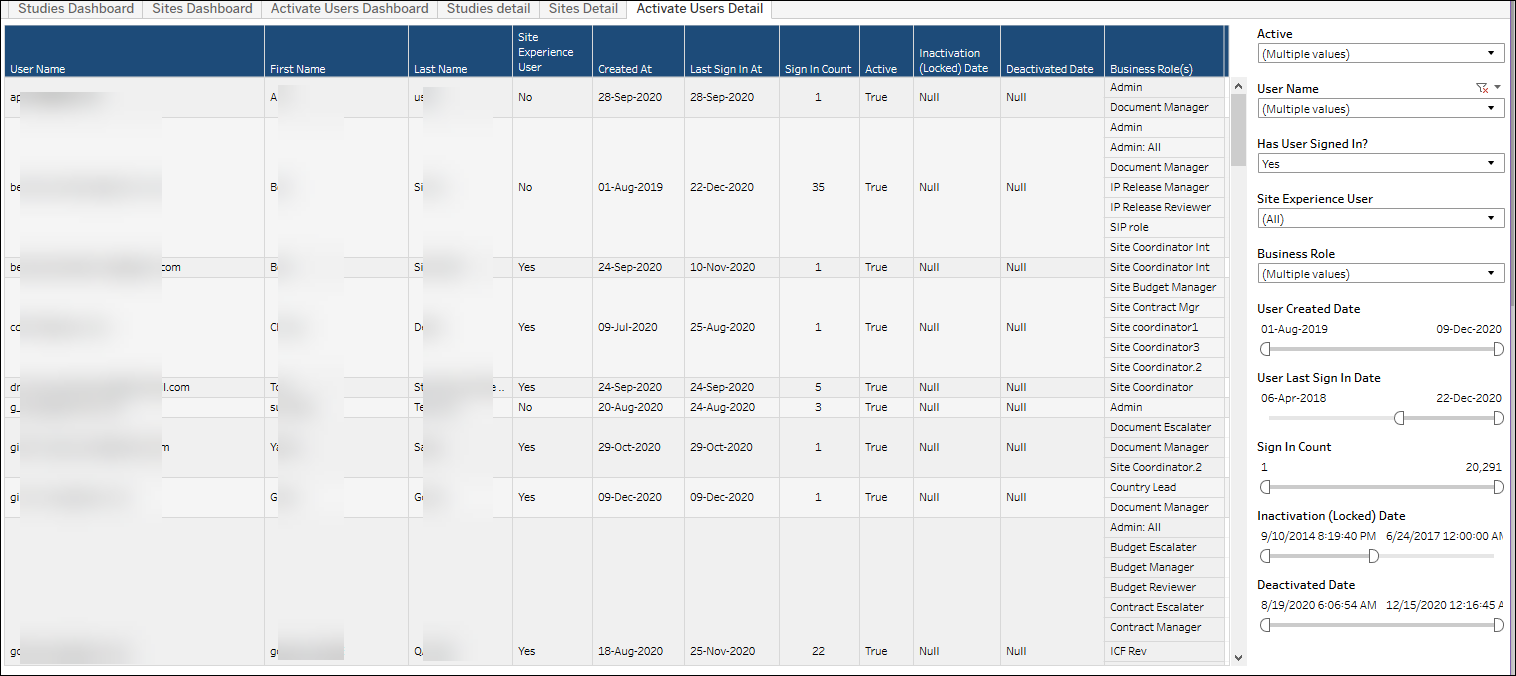
- You can view the user detail on the "Activate Users Detail" worksheet of this workbook. The worksheet provides several filters (e.g., User Name, Business Role, Sign in Count, etc.) that allow you to subset the data included in the detail worksheet.
- If there were no users created for a particular period, you will not see data for that period in the dashboard.
Activate Users Dashboard sheet
Activate Users Detail sheet
