17 Study Startup Industry Benchmarking
Workbook synopsis
- Essential docs sent to site – Contracts executed
- Contracts executed – IP release ready
- Essential docs sent to site – IP release ready
Dashboards and sheets
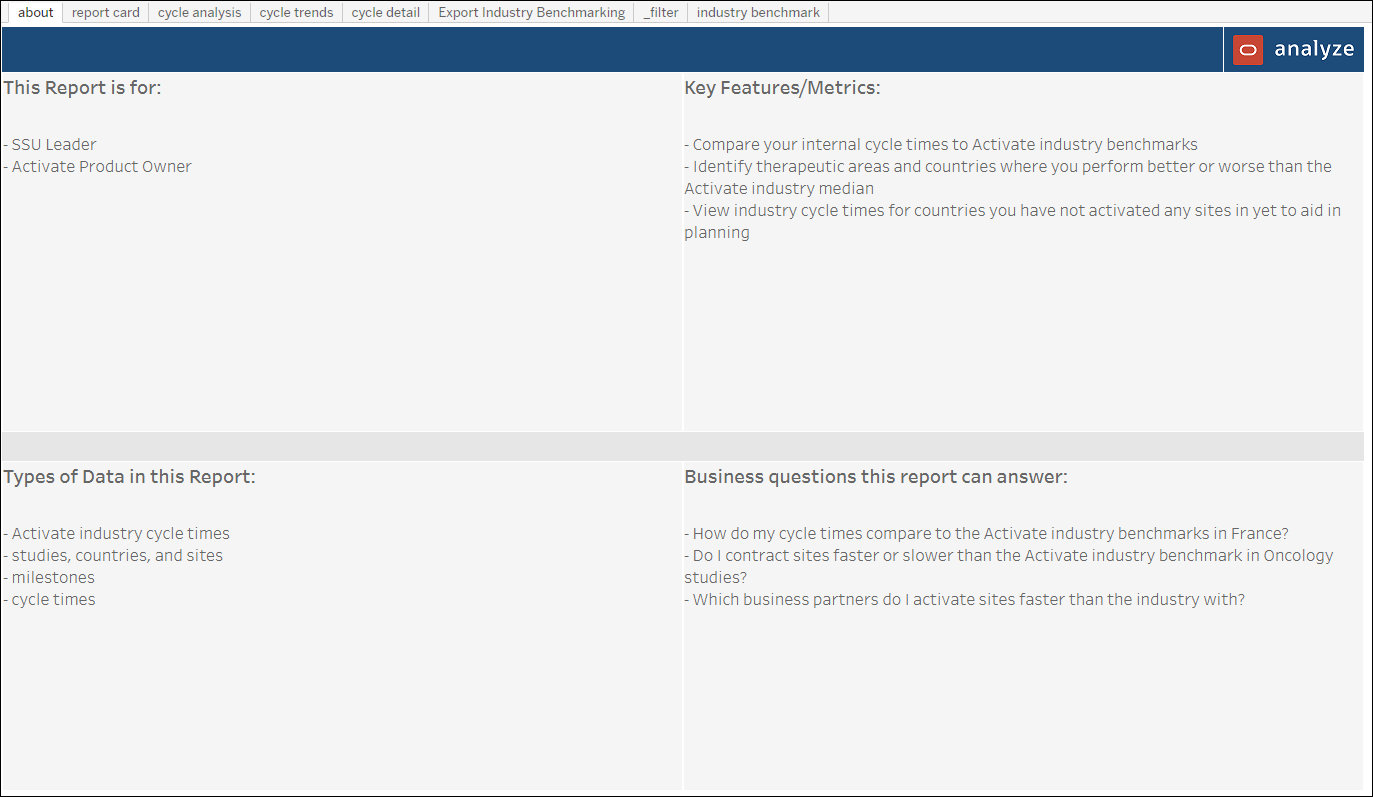
About
- Study startup roles that would use the report
- Key report features and metrics
- Types of data the report contains
- Examples of how to use the report to answer a business question
Industry Benchmark
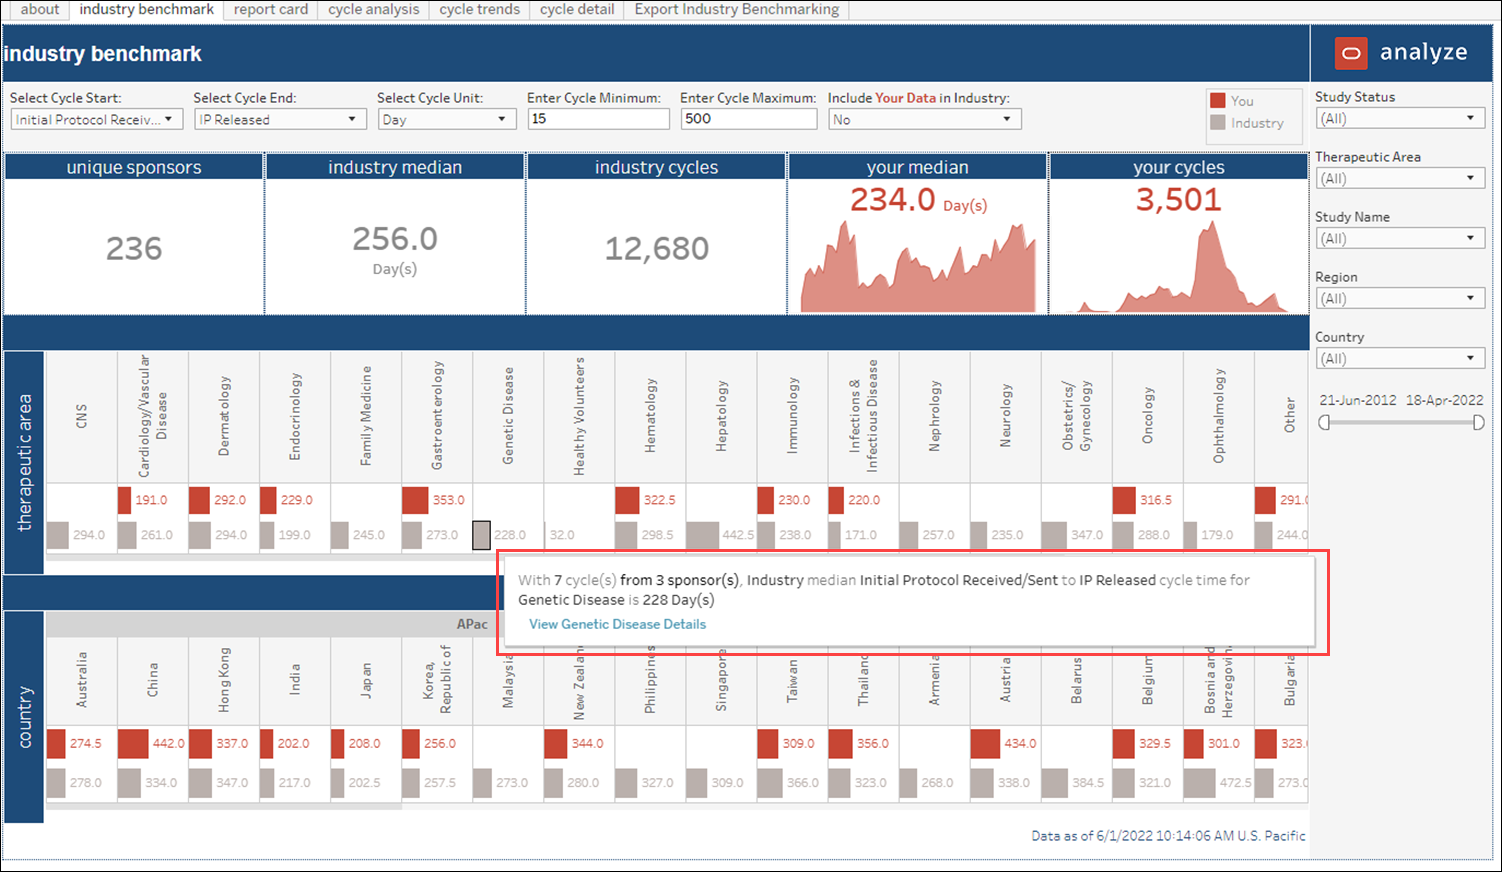
The workbook’s Industry Benchmark worksheet is a configurable dashboard view. You can specify the following data points to visualize cycle time comparisons in the dashboard:
- Cycle start
- Cycle end
- Cycle unit
- Cycle minimum
- Cycle maximum
The configuration section at the top of the dashboard includes an optional “Include my data” setting. When set to Yes, your organizational data is included in the dashboard’s industry comparison. With the cycle time configuration values either selected or entered, the Industry Benchmark dashboard’s top section displays these key performance indicators:
- Unique sponsors
- Industry median
- Industry cycles
- Your median (with a trend graph below)
- Your cycles (with a trend graph below)
The dashboard's lower section presents therapeutic area and country benchmark tables. Both tables include a bar chart of the industry median and your median. Hover over functionality allows you to access site details in both benchmark tables including, for instance, the total sponsor count in the tool tips for industry data.
You can optionally filter the dashboard by: Study Status, Therapeutic Area, Study Name, Region, Country, and date range.
Report Card
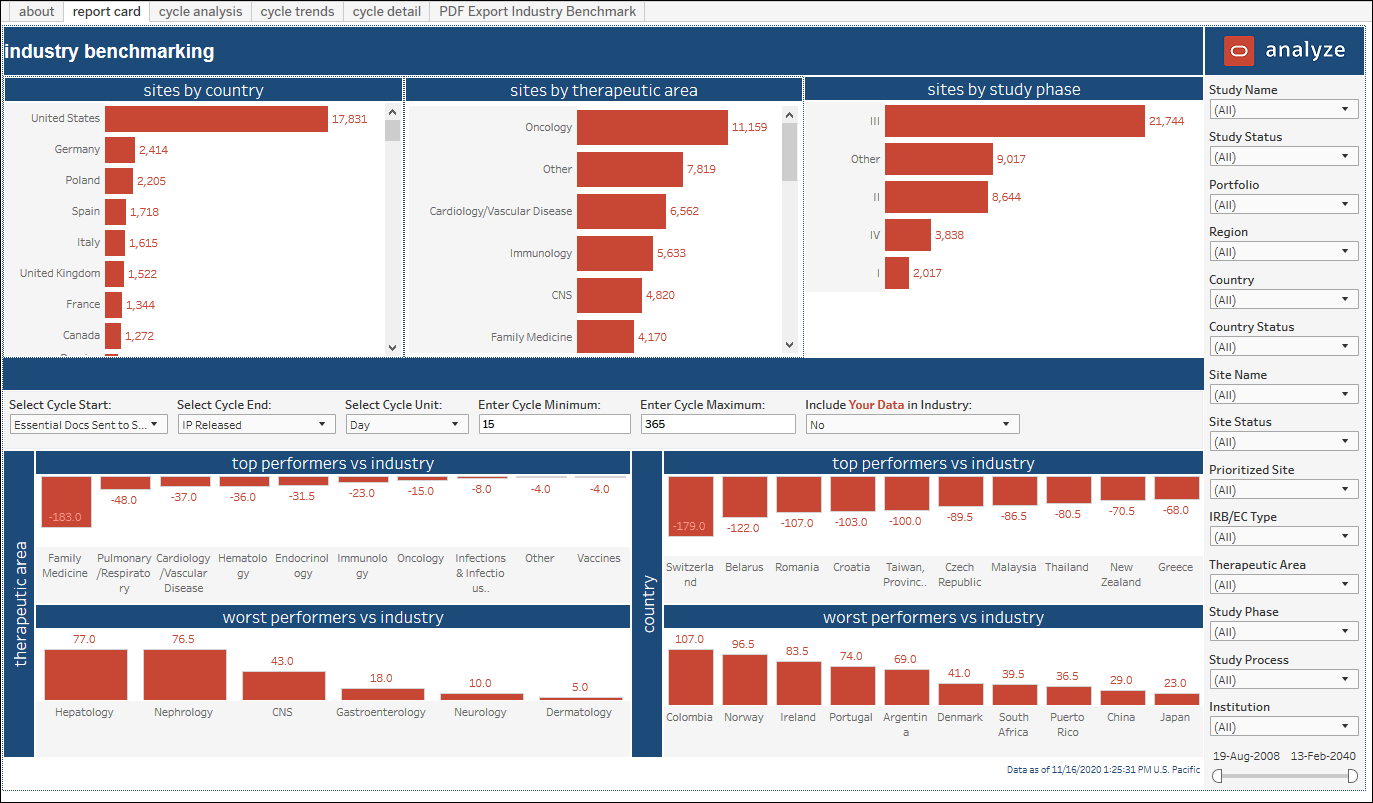
The upper portion of the Report Card dashboard displays your statistics: site count by country, site count by therapeutic area, and site count by study phase. Using the options to the right, you can filter the dashboard by study status, study name, therapeutic area, region, country, institution, cycle end date, and minimum number of cycles completed. You can also optionally exclude negative cycle times from the dashboard's calculations.
The lower half of the report card worksheet provides you with performance bar chart visualizations. The left side includes two therapeutic area bar charts that show top performing therapeutic area vs. industry and worst performing therapeutic areas vs. industry. The lower right includes two vertical bar charts by country that show top performing countries vs. industry and worst performing countries vs. industry.
You can filter the performance section by selecting:
- Cycle Start
- Cycle End
- Cycle Unit
- Cycle Minimum
- Cycle Maximum
- Include Your Data in Industry (Yes/No)
Cycle Analysis
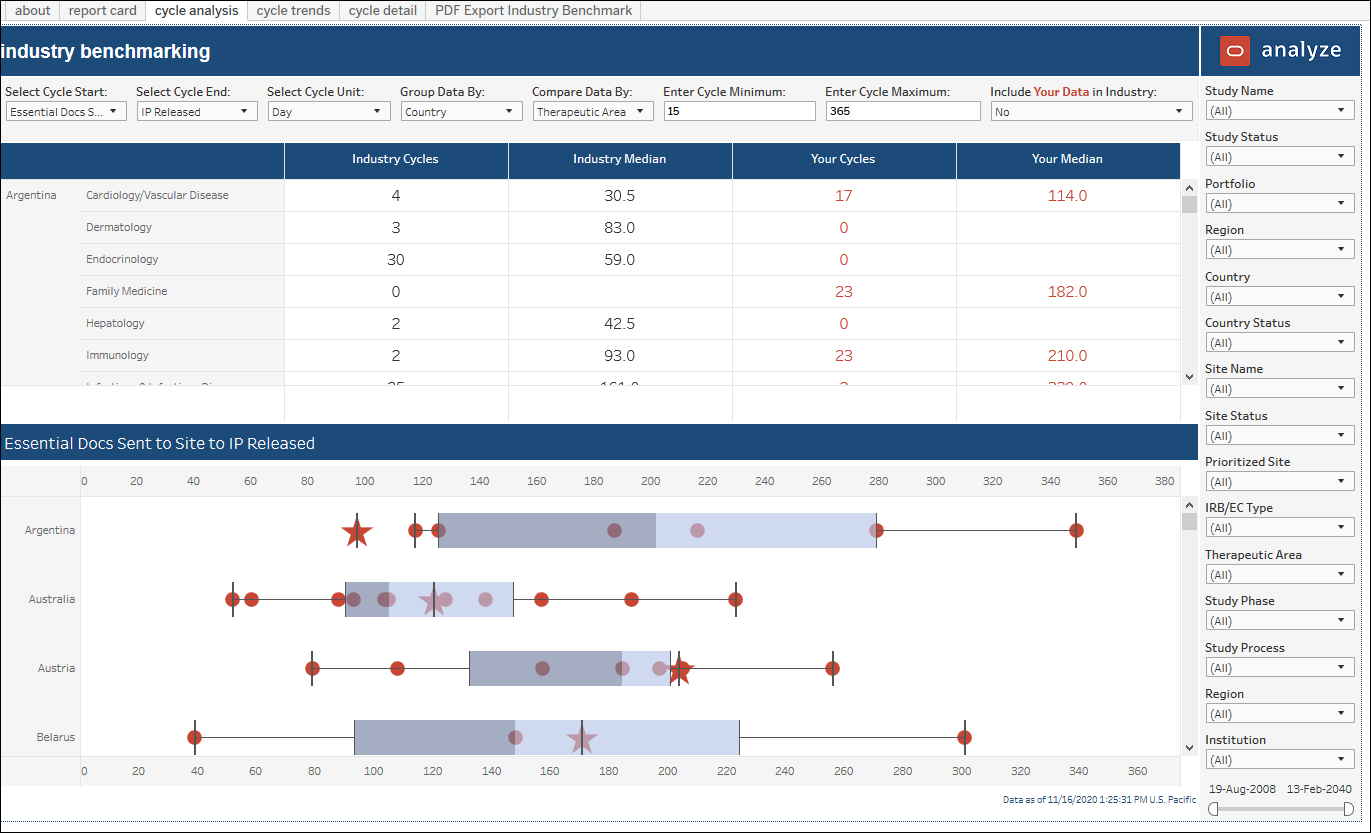
The second tab in the Study Startup Industry Benchmarking workbook is a cycle analysis dashboard. The upper portion of the dashboard includes a tabular version of the cycle time diagrams at the bottom of the dashboard. You can quickly see the exact values of the industry medians compared with your account medians.
The lower section of the dashboard displays median cycle time vs. industry benchmark as a whisker plot diagram. Hover over any star to view the Oracle industry benchmark. Hover over any circle to view your own median cycle time over cycles. Hover over any bar to view upper, median, and lower values.
Cycle Trends
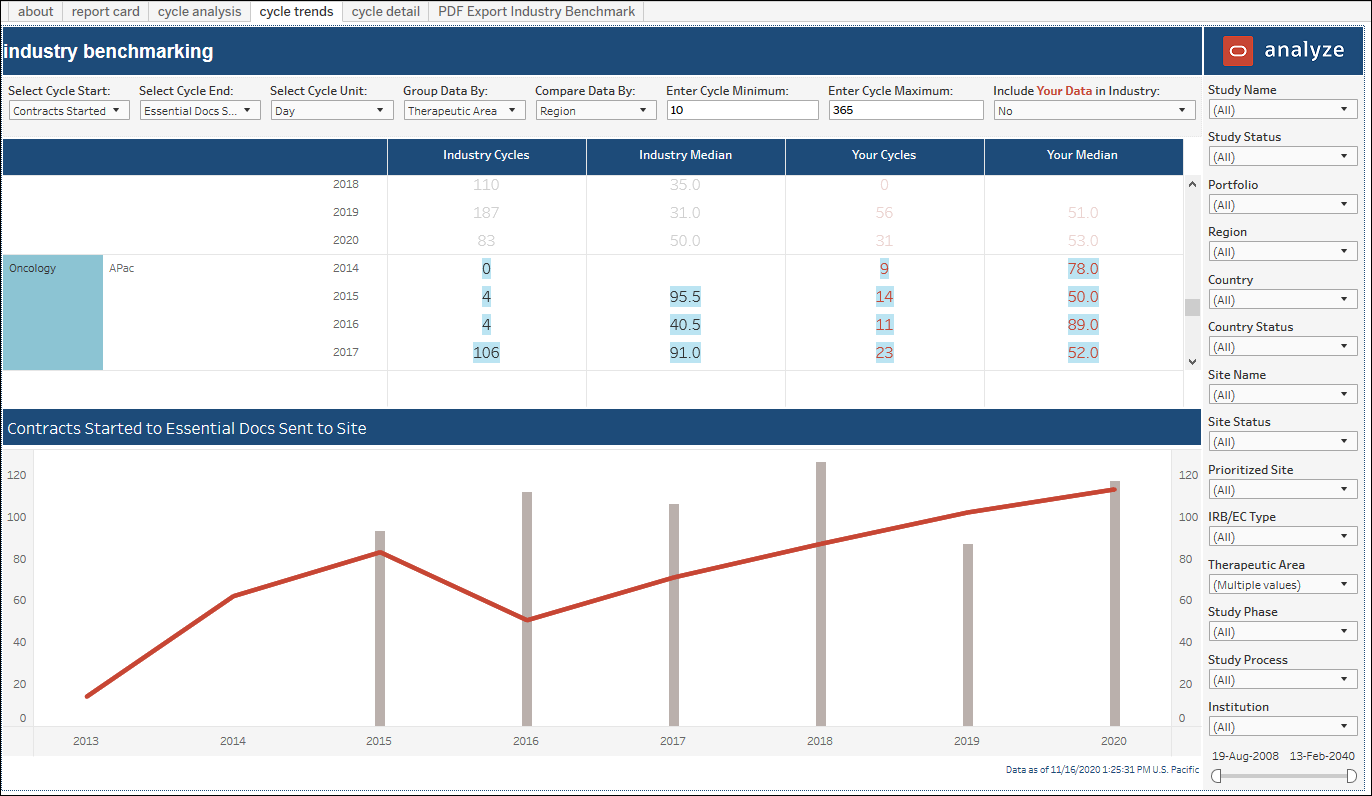
- trend by parameter
- your number of cycles
- your cycle median
- industry number of cycles
- industry median
When you click a data point in the upper section (e.g., user clicks on a country name or a Benchmark Median count), the trend graph below displays the data point in the graph. You can then hover over points in the graph to view median, benchmark median cycle time, and/or your organization's median cycle time.
The report also includes a toggle in the filter selection panel that allows you to easily include and exclude your own organization's data from the industry benchmark for therapeutic areas and countries.
Cycle Detail
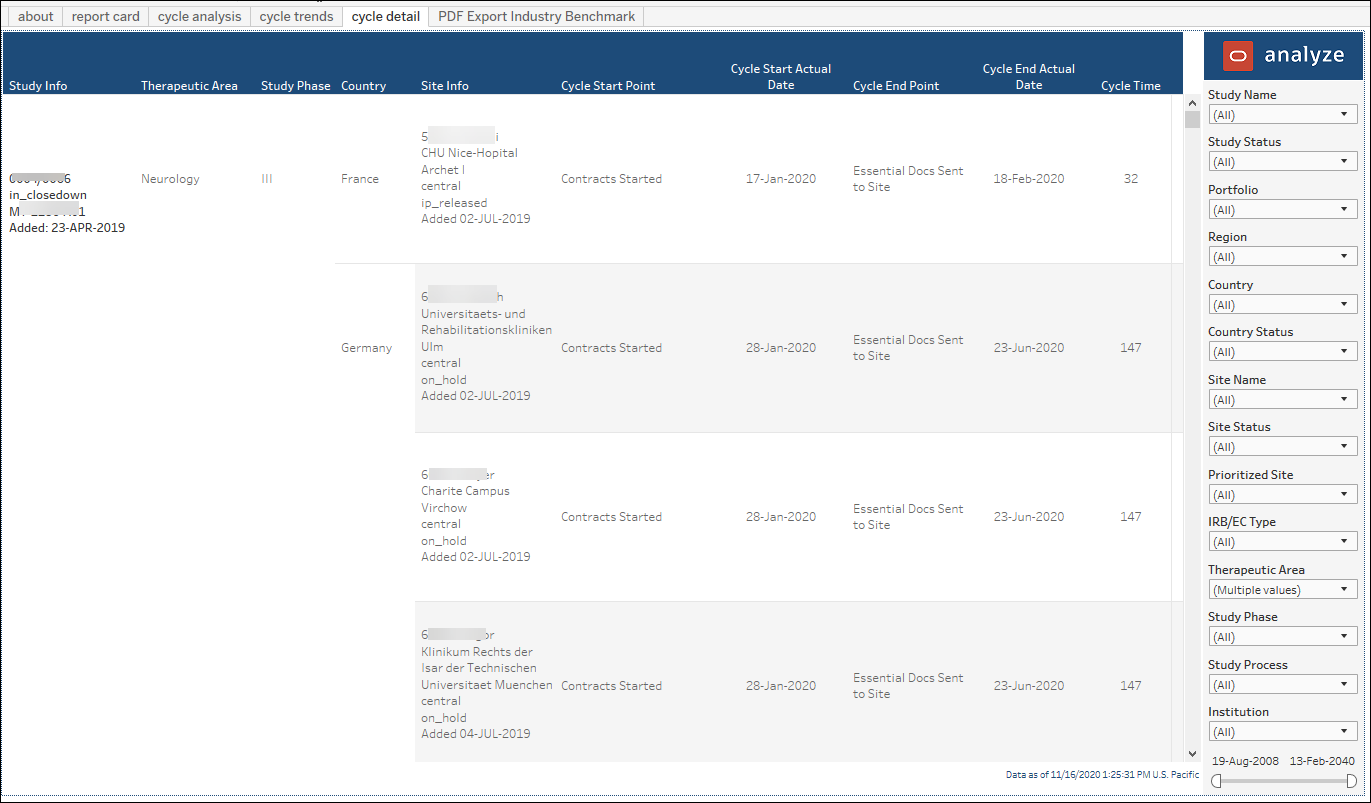
The Cycle Detail worksheet includes a tabular view of data used to create cycle benchmarking comparisons.
Export Industry Benchmarking
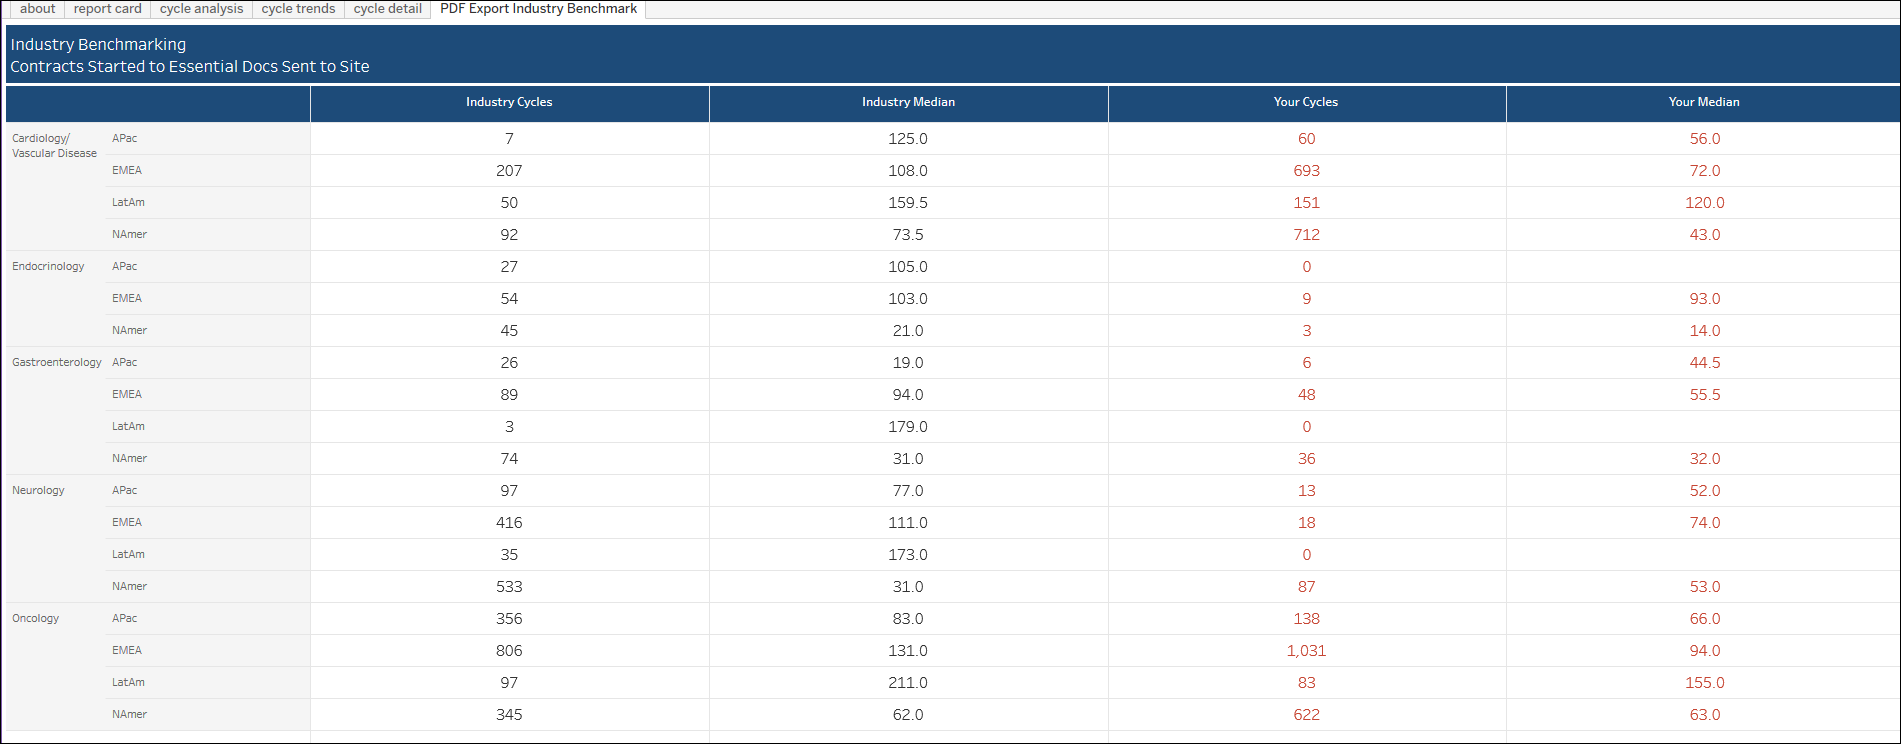
The Export Industry Benchmarking worksheet gives you a simple way to export high-level benchmarking metrics to PDF or CSV format. The PDF or CSV format report can then be shared with other interested parties, as preferred.
The export worksheet presents benchmark metrics in tabular format with the following columns:
- Data slice – reflects the “Group data by” dimension selected on the Cycle Analysis worksheet
- Data compare – reflects the “Compare data by” dimension selected on the Cycle Analysis worksheet
- Industry Cycles
- Industry Median
- Your Cycles
- Your Median
When you export the worksheet, the PDF or CSV version includes the worksheet data in the same format it appears in the browser.
