5 Next Actions
Workbook synopsis
The Oracle Site Analyze Next Actions dashboard, intended for Oracle Site Select customers, allows you to monitor site task progress by surfacing available tasks as well as how many days a task has been available. Use this information to evaluate when to follow up with sites who may have tasks that have not progressed for an extended period.
Dashboards and sheets
Next Actions
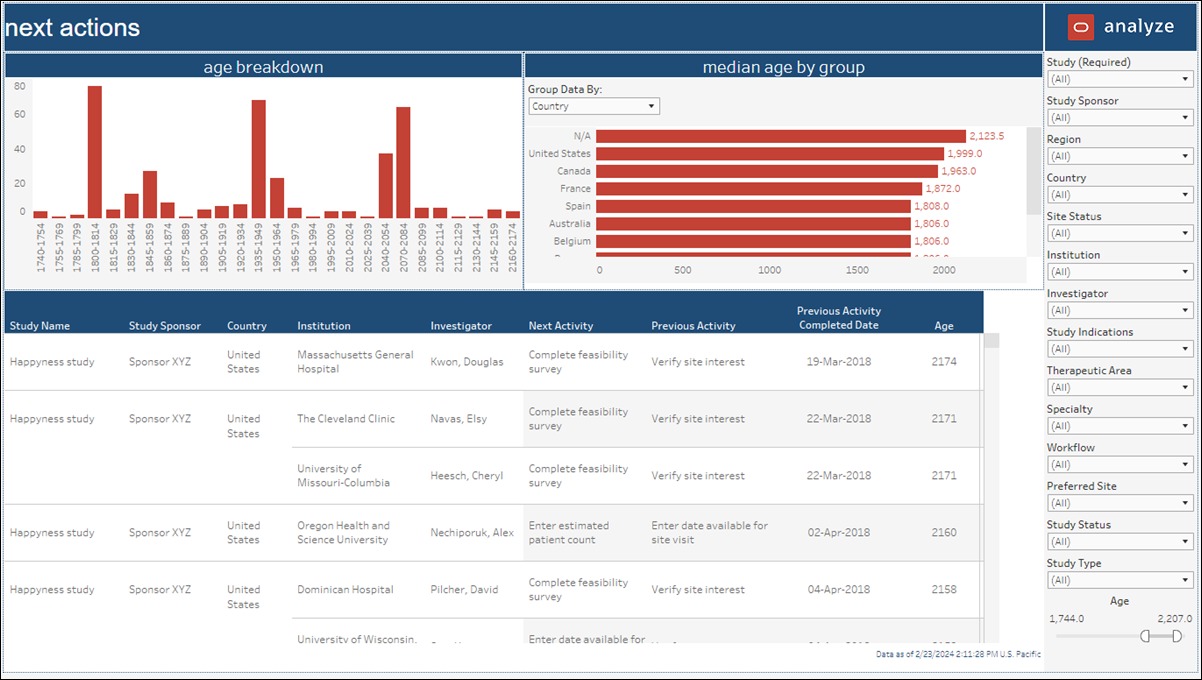
The top of the Next Actions dashboard includes two bar charts. The left chart, Age Breakdown, shows the number of available tasks by number of days the tasks have been available. The chart to the right, Median Age by Group, shows median activity age, and you can adjust this chart to show median by:
-
- Assigned user
- Study
- Region
- Country
Click any bar in the Age Breakdown or Median Age by Group bar chart to filter the lower section of the report, which is a tabular view of following data:
-
- Study Name
- Study Sponsor
- Country
- Institution
- Investigator
- Next Activity
- Previous Activity
- Previous Activity Completed Date
- Age
The filter panel to the right provides a wide range of filters so you can easily subset the report data to a preferred view. In addition to standard filters (e.g., Study Sponsor, Study Name, Region, etc.) the right panel also includes Workflow, Preferred Site, Study Status, Study Type, and Age range filters.
