10 Site Progress
Workbook synopsis
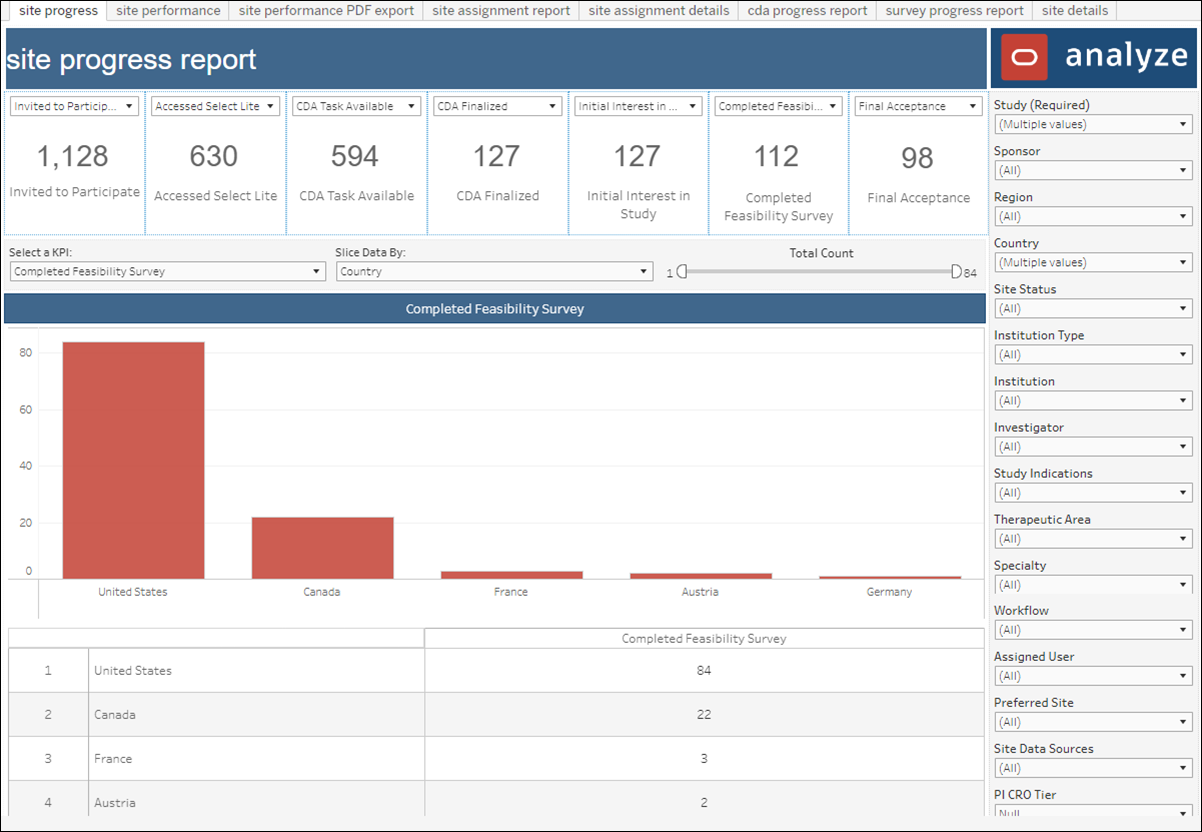
The Oracle Site Analyze Site Progress report, intended for Oracle Site Select customers, allows you to view a summary of where sites are in the selection process and helps you to identify barriers to site progress.
Dashboards and sheets
Site Progress KPI
- Invited to Participate
- Accessed Select LITE
- CDA Task Available
- CDA Final Review
- CDA Finalized
- Agreed to Confidentiality
- Initial Interest in Study
- Final Interest in Study
- Completed Feasibility Survey
- Final Acceptance
- N/A
- Bucket – Back up
- Bucket – Declined
- Bucket – Do not invite
- Bucket – Final acceptance
- Bucket – Final decline
- Bucket – Invited
- Bucket – Master list
- Bucket – Nominated
- Bucket – Not interested
- Bucket – On hold
- Bucket – Selected
- Bucket – Short list
You can also specify the KPI/bucket state in the lower section of the worksheet. To further refine the view, use the “Slice Data By” filter in the lower section to slice by study, region, or country. Adjust the position of the“Total Count” slide to control the displayed range from lowest to highest value.
Site Performance
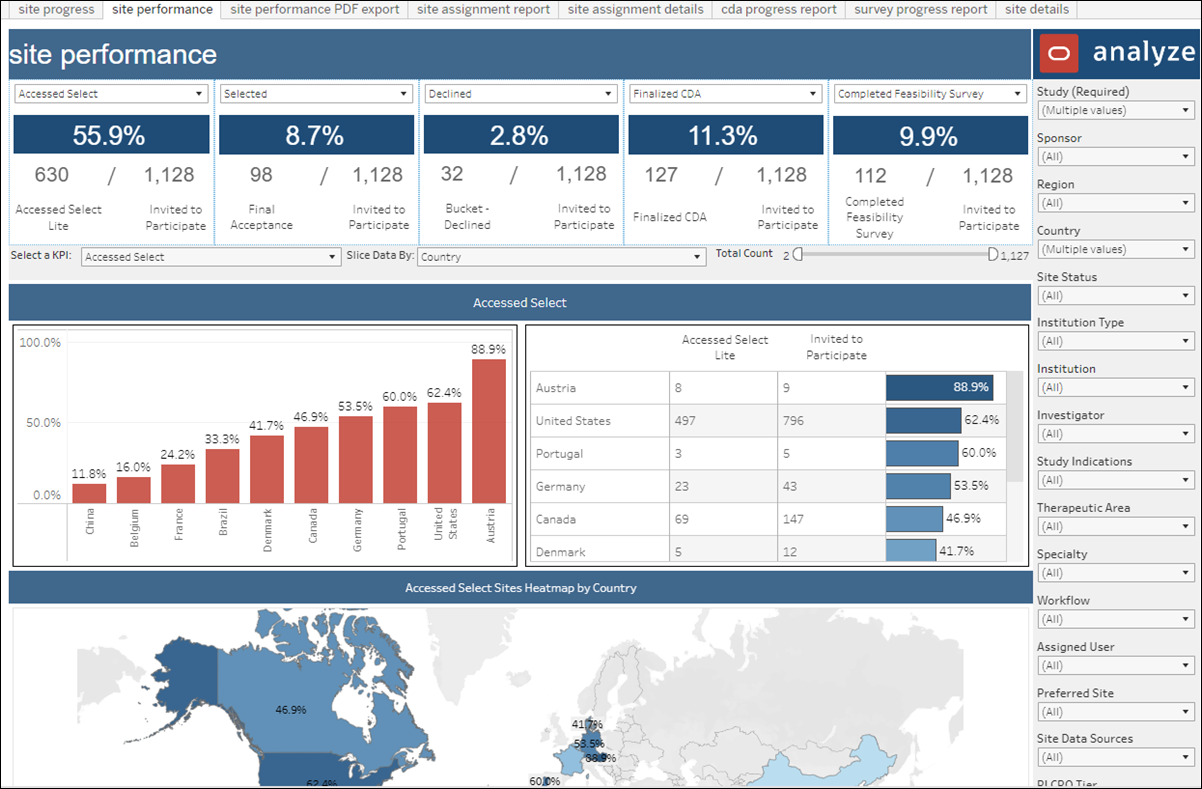
- Accessed Select – number of sites that accessed Oracle Site Select LITE divided by the number of sites invited to participate
- Selected – number of sites selected divided by the number of sites invited to participate
- Declined – number of sites who declined to be in the study divided by the number of sites invited to participate
- Finalized CDA – number of sites that have completed the CDA divided by the number of sites invited to participate
- Completed Feasibility Survey – number of sites that have completed a survey divided by the number of sites invited to participate
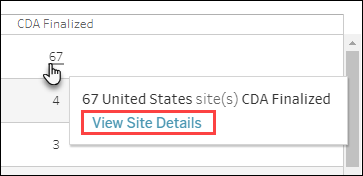
The center section of the Site Performance dashboard shows a breakdown of a selected KPI with a bar chart to the left and a table to the right. Slice the data as you prefer – by Assigned user, Study, Region, or Country. You can also adjust the data using the Total Count slider. When you click into a table cell, a tool tip displays a link to “View Site Details.” If clicked, the Site Details worksheet displays with the site information that made up that table cell’s metric.
The dashboard’s lower section is a geographical heat map that reflects countries for which KPI data exist. The map reflects the KPI selected in the center section of the dashboard, and the map displays percentage results in gradient blue (lighter blue, lower percentage through darker blue, higher percentage). When a country has no site data, the map reflects the country in light gray. Click a country to drill to the Site Details worksheet to view site information that made up that country metric.
As with all Oracle Site Analyze reports, the Site Performance dashboard's right panel provides a broad range of filters to subset the data.
Site Performance export worksheet
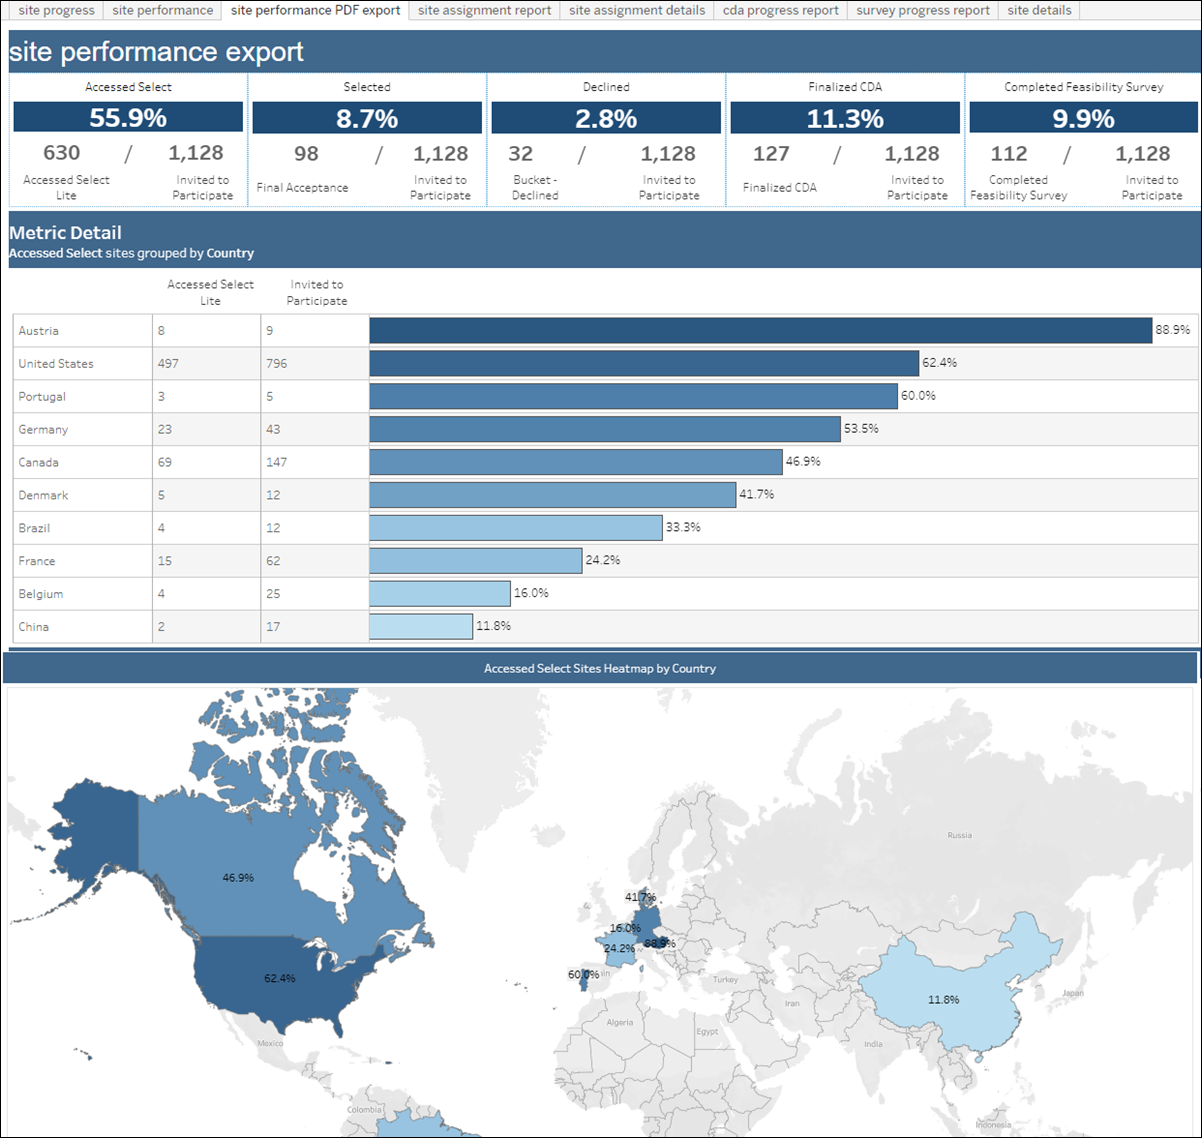
The Site Performance PDF Export worksheet provides a convenient way to export filtered information from the Site Performance Dashboard to a format suitable to share with sponsors.
The export sheet reflects currently selected options and filters from the Site Performance Dashboard, and any adjustments to the dashboard’s parameters automatically update the export PDF. By design, the export worksheet does not include a filter panel or other editable parameters (e.g., KPI selectors, Slice data by selectors, etc.).
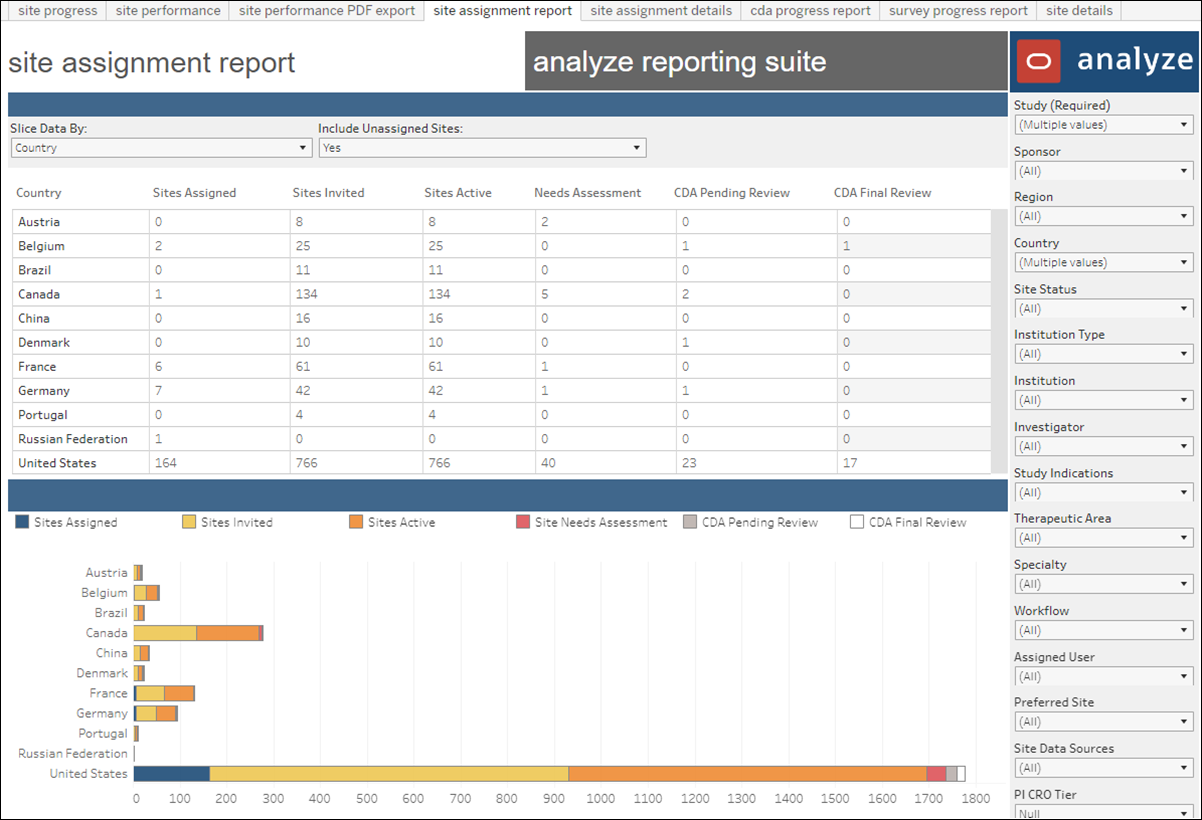
Site Assignment Report
- Study
- Sites Assigned = Number of sites assigned
- Site Invited = Number of sites invited
- Sites Active = Number of sites active (invited but not in a dropped bucket state)
- Needs Assessment = Number of sites with all tasks complete and still in the invited bucket
- CDA Pending Review = Number of CDA uploaded pending review
- CDA Final Review = CDA uploaded final review
The Site Assignment Report also includes a stacked bar chart where you can slice the above data by region, country, study, and assigned users. You can drill to site details, as preferred, from either the tabular data or the bar chart data.
Site Assignment Details
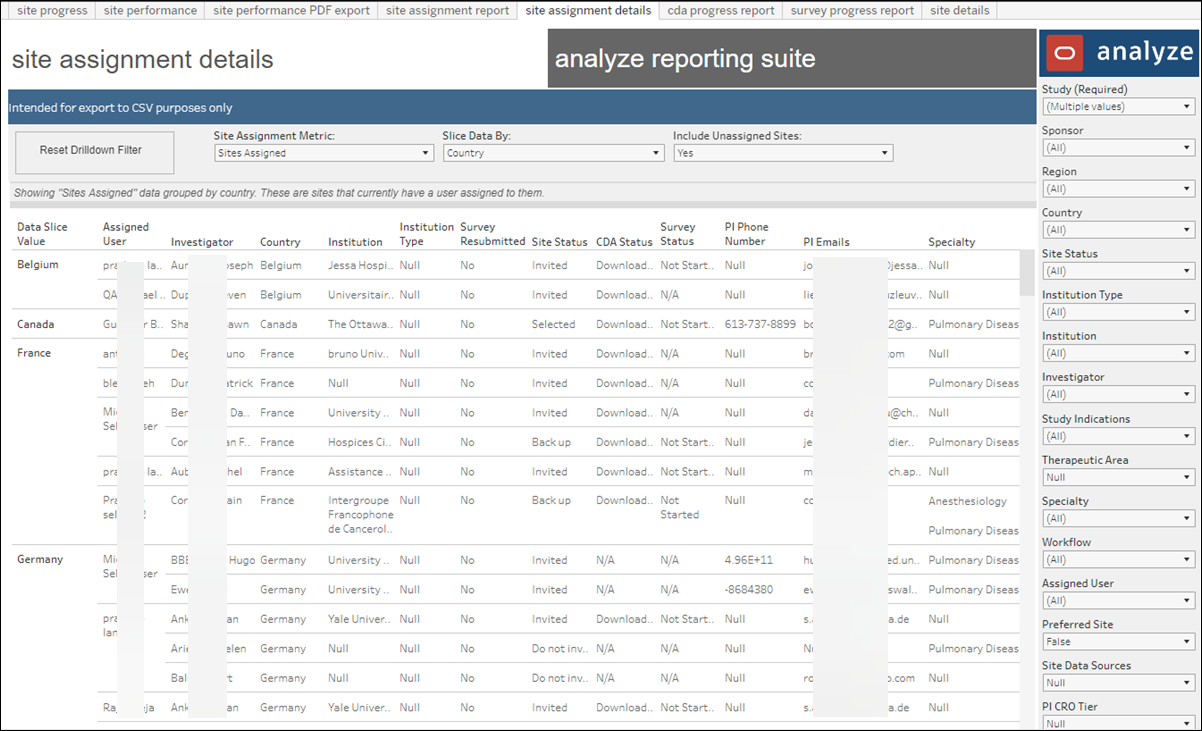
The Site Assignment Details worksheet allows you to filter and export site assignment detail to a CSV format file.
CDA Progress Report
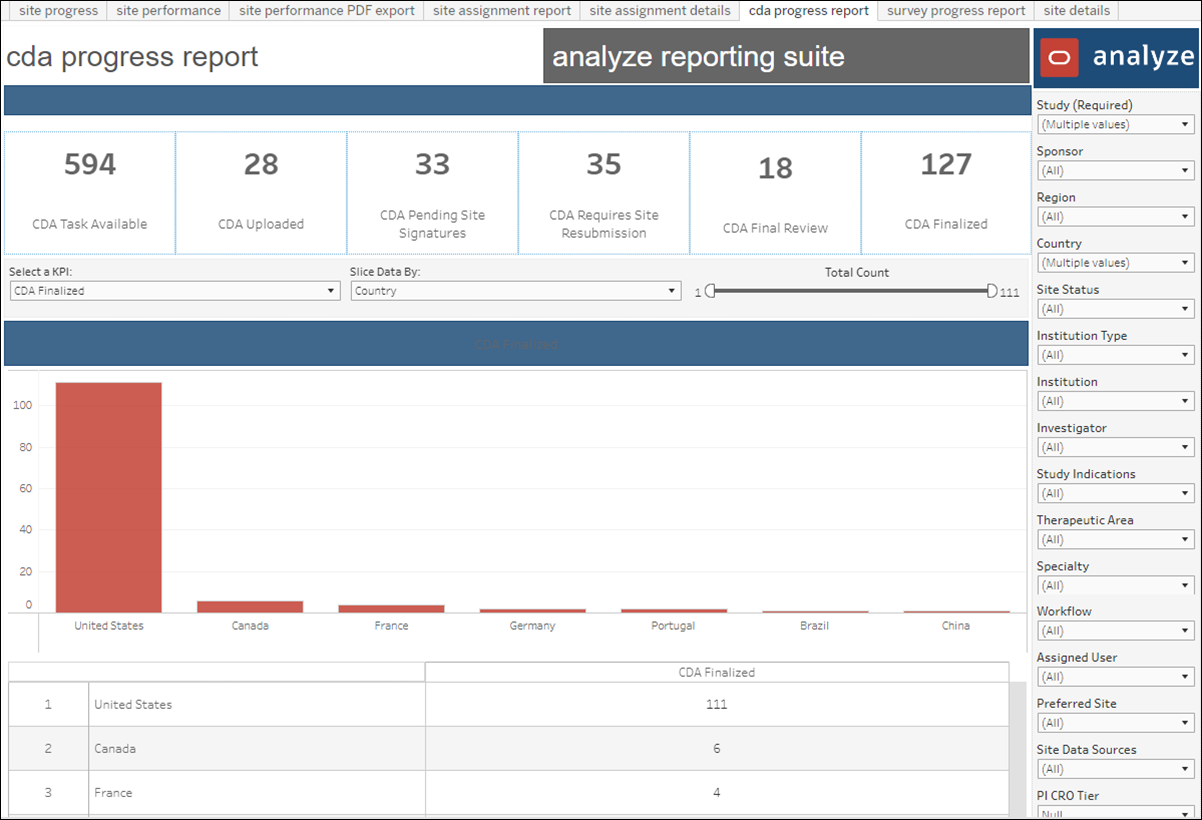
- CDA Task Available
- CDA Uploaded
- CDA Pending Site Signatures
- CDA Requires Site Resubmission
- CDA Final Review
- CDA Finalized
Survey Progress Report
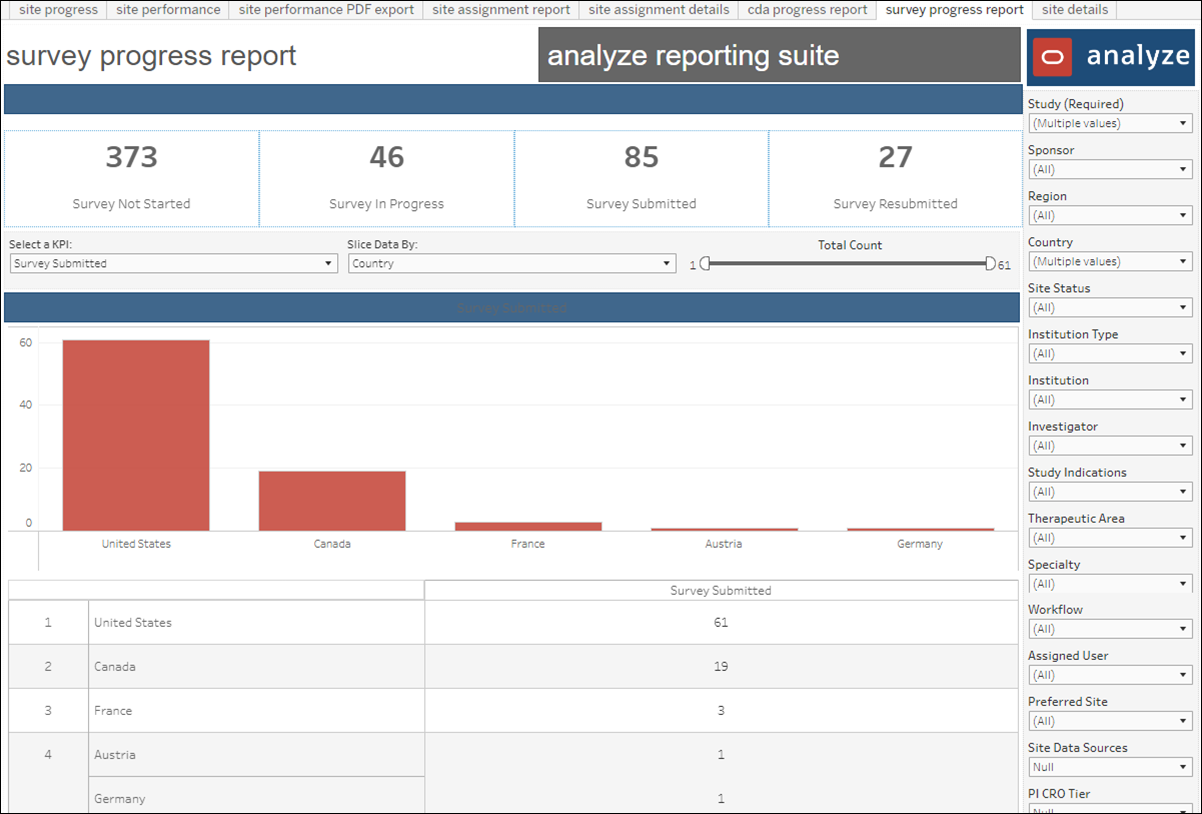
- Not started (when the site has reached the feasibility survey workflow task)
- In Progress
- Submitted
- Resubmitted
Site Details
- Study Name
- Investigator
- Country
- Institution
- Institution type
- Survey Resubmitted
- Site Status
- CDA Status
- Survey Status
- PI Phone Number
- Specialty
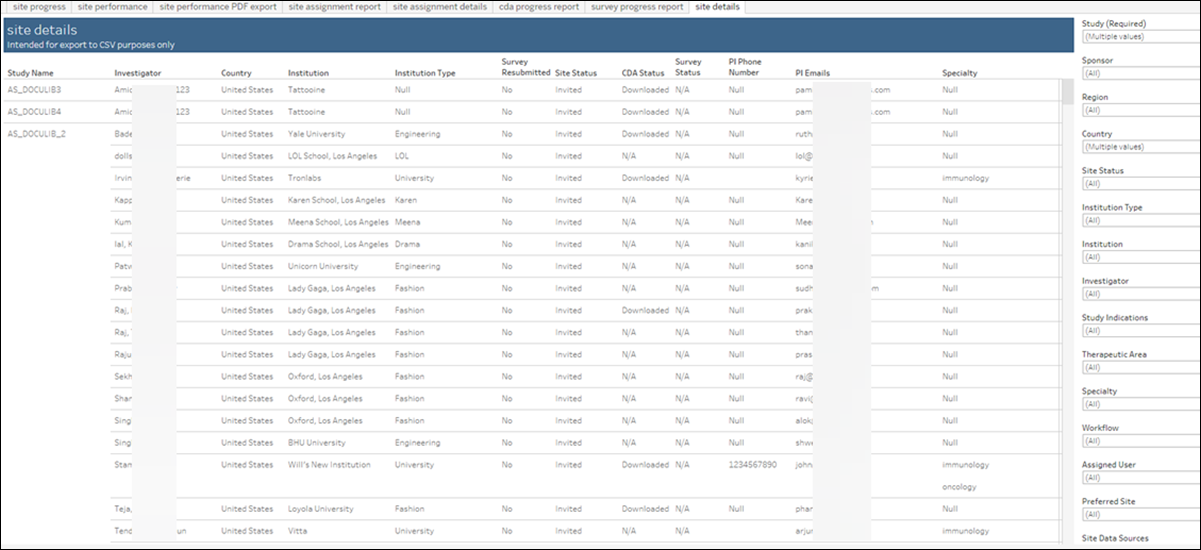
When you hover over a top KPI or a number in the country table in the Site Progress Report, CDA Progress Report, or Survey Progress Report worksheet, a tooltip displays with a “View Site Details” link. When you click this link, the Site Details worksheet (above) displays details for the sites that make up that specific number.
