3 Adoption Dashboard
Workbook synopsis
The Adoption Dashboard provides your organization with a convenient way to evaluate overall Oracle Site Activate usage and adoption through a series of dashboard views. This report is the first in a two-report set that provide user adoption information. The second report is Adoption Dashboard - Artifacts and Activities.
Dashboards
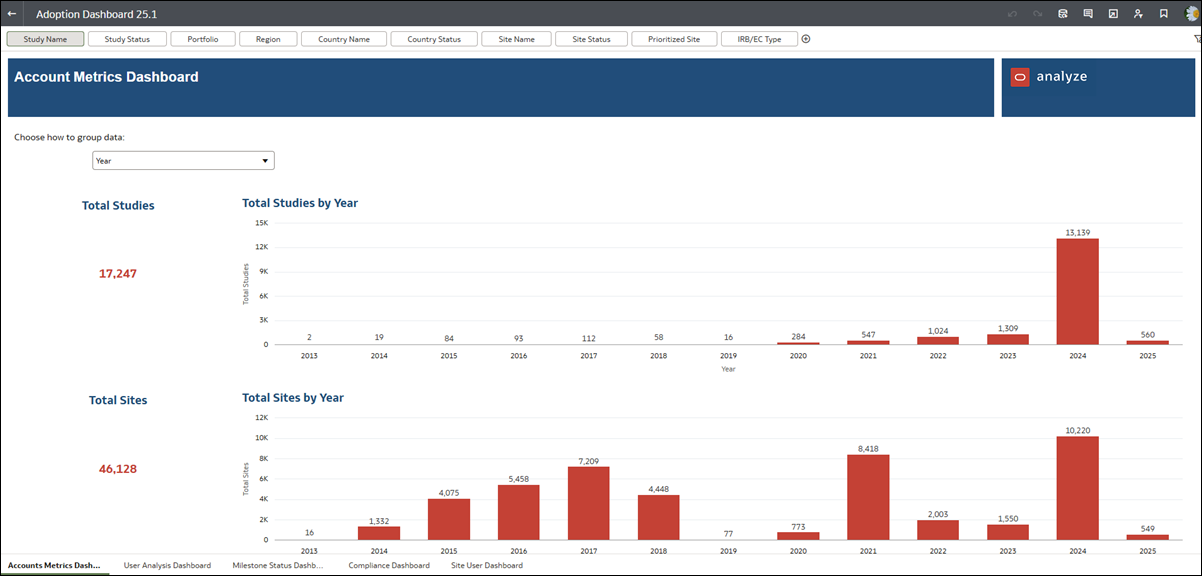
Account Metrics Dashboard worksheet
This dashboard includes Key Performance Indicator (KPI)s for Total Studies, Total Sites, and Total Users. Use the "Choose how to group data" filter to adjust the bar graph groups.
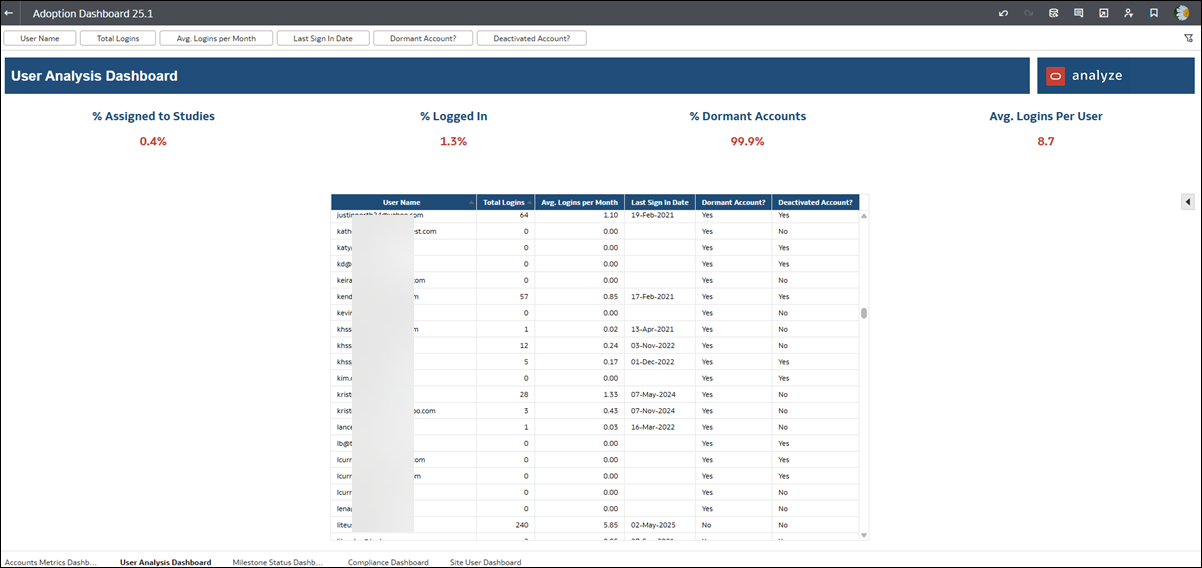
User Analysis Dashboard worksheet
- Percentage of users assigned to studies
- Percentage of users who have logged in
- Percentage of dormant accounts (no login for at least 90 days)
- Average logins per user
The lower section of the dashboard includes tabular data for the following:
- User Name
- Total Logins
- Average Logins Per Month
- Last Sign In Date
- Dormant Account (Yes/No)
- Deactivated Account (Yes/No)
You can easily subset the table data using filters displayed above the worksheet. For instance, you can set the report to include only deactivated and/or dormant users, display data for one or multiple individual users, etc.
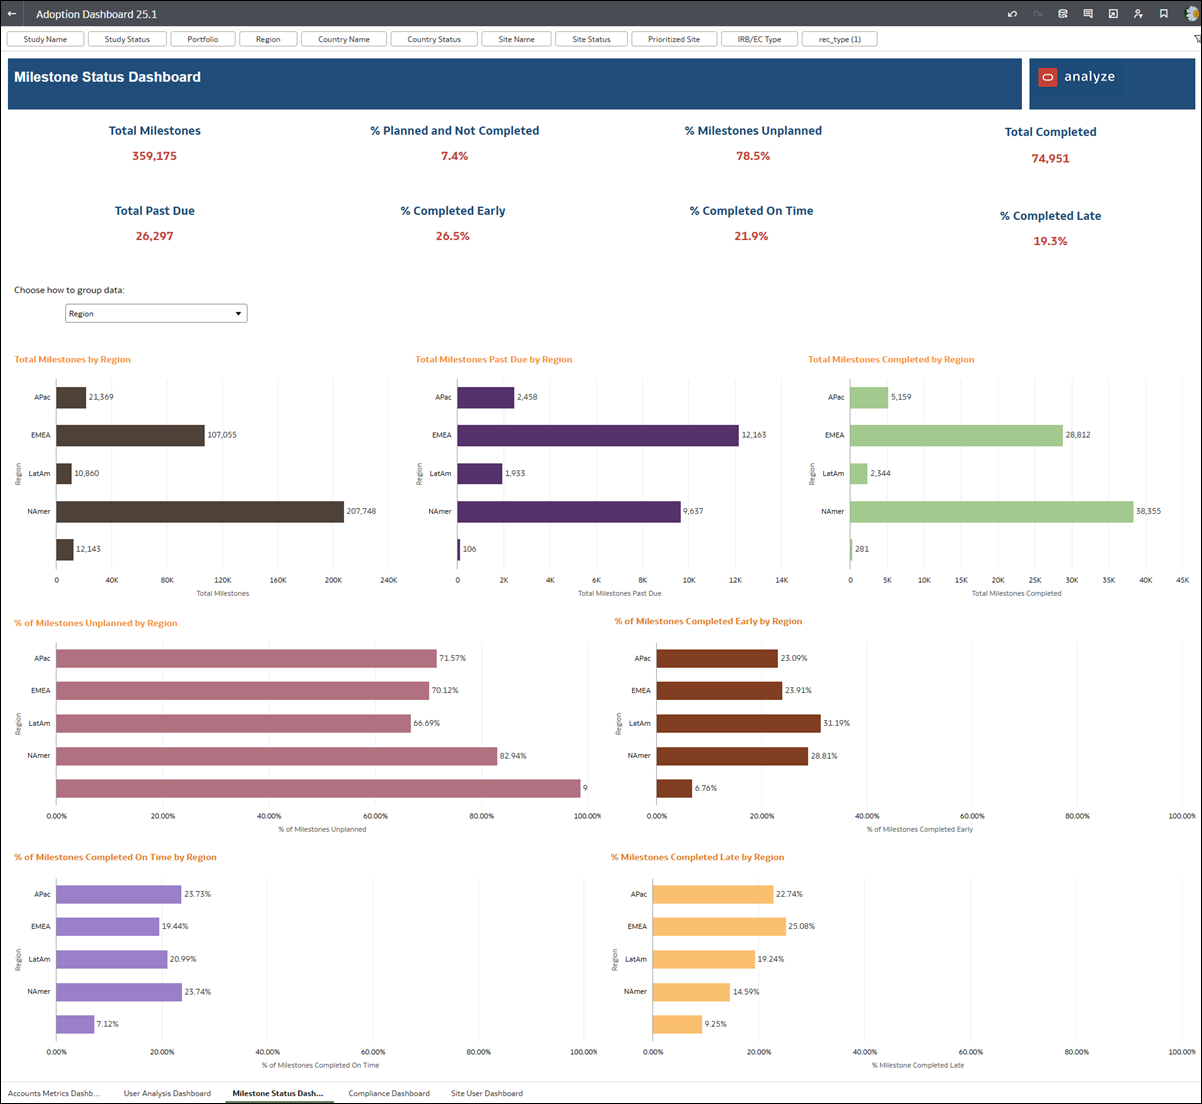
Milestone Status Dashboard worksheet
- Total Milestones
- % of Milestones Planned and Not Completed
- % Milestones Unplanned
- Total Milestones Completed
- Total Milestones Past Due
- % of Milestones Completed Early
- % of Milestones Completed On Time
- % of Milestones Completed Late
The dashboard's lower section displays multiple bar graphs for milestone data. You can choose how to group the displayed data (e.g., Portfolio, Study, Country, or Region). You also have familiar filters available above the worksheet (e.g., Study Status, Portfolio, Study Name, Region, and Country), as well as filters for Site Status, Site Name, Prioritized Site, and IRB/EC Type.
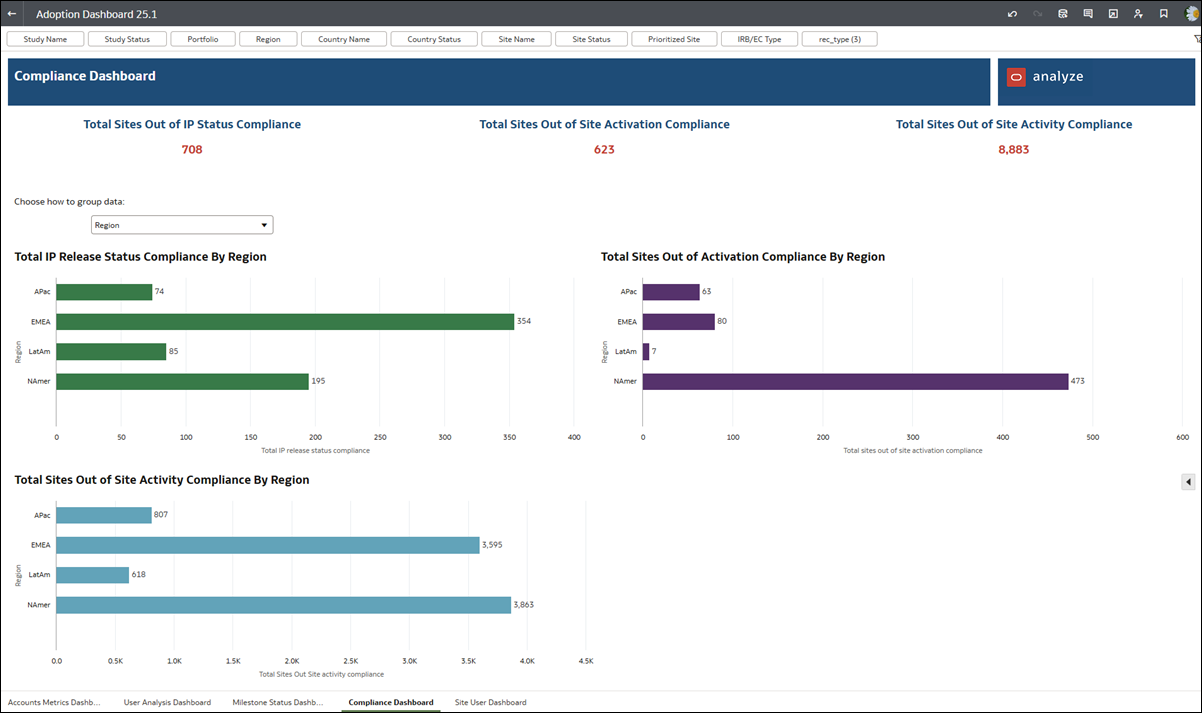
Compliance Dashboard worksheet
- Total Sites Out of IP Status Compliance (i.e., sites with "IP release ready" milestone completed and site status is not "IP released")
- Total Sites Out of Site Activation Compliance (i.e., sites that have completed "Essential docs sent to site" milestone more than 200 days ago and "IP release ready" milestone is not completed)
- Total Sites Out of Site Activity Compliance (i.e., sites that have not had an activity completed in over 100 days and "IP release ready" milestone is not completed)
The dashboard's lower section displays compliance data in a bar graph. You can choose how to group the displayed data (Portfolio, Study, Country, or Region). Filter options above the worksheet allow you to subset the data.
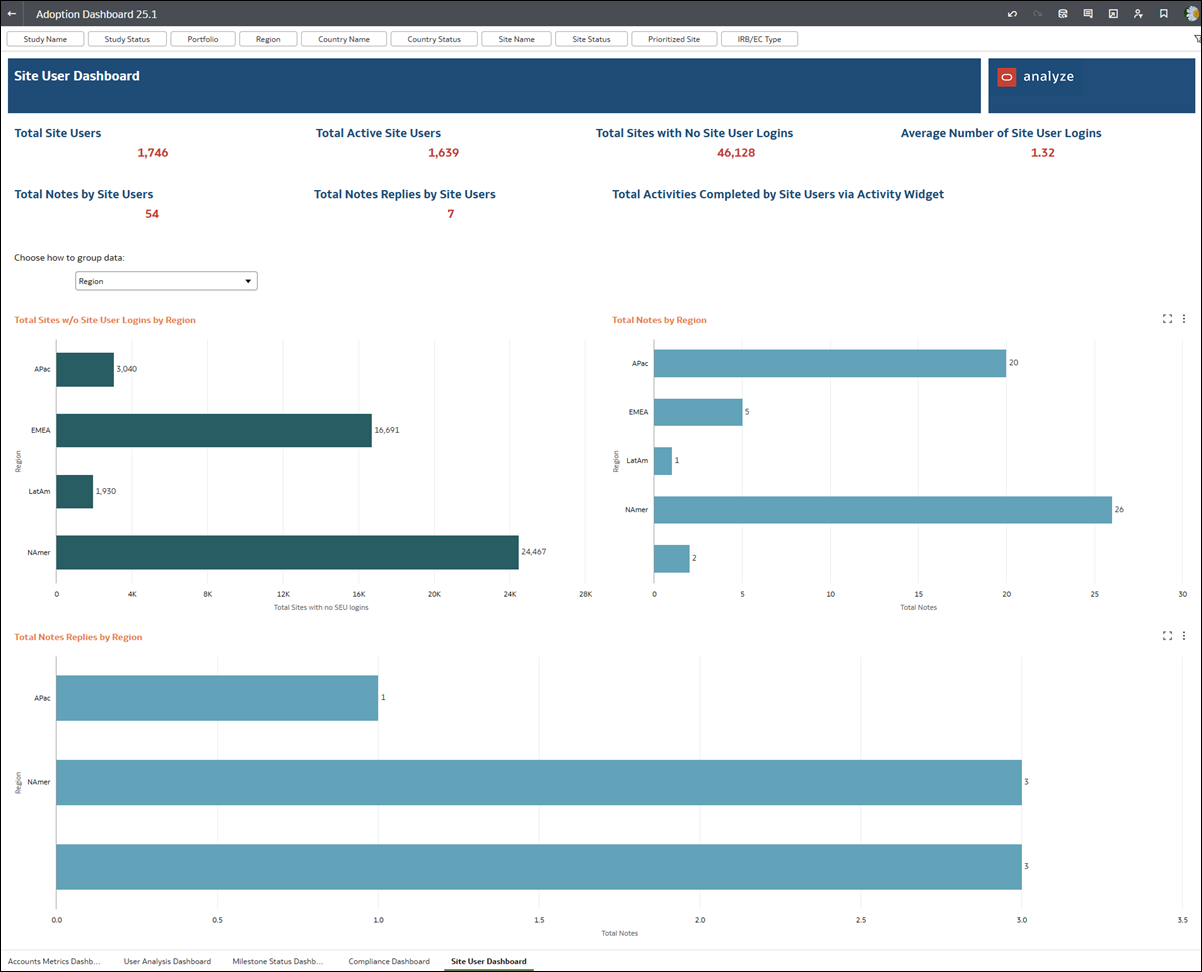
Site User Dashboard worksheet
- Total Site Users
- Total Sites with No Site User Logins
- Average Number of Site User Logins
- Total Notes
- Total Notes Replies
The dashboard's lower section displays site user data in a bar graph. You can choose how to group the displayed data (Portfolio, Study, Country, or Region). You can further refine the displayed data using filters above the worksheet.
Note:
Please refer to the Site User Dashboard included in the Adoption Dashboard – Artifacts and Activities report to see additional site metrics and visualizations. The Adoption Dashboard – Artifacts and Activities report shows Total activities by site users via activity widget metric and a Total site page activities by region bar graph. Oracle maintains this information separately to ensure acceptable performance for both Adoption reports.
