4 Adoption Dashboard - Artifacts and Activities
Workbook synopsis
The Adoption Dashboard – Artifacts and Activities report provides your organization with an easy way to evaluate Oracle Site Activate usage and adoption through a series of dashboard views. This report is the second of a two-report set that provide user adoption information. The first report is Adoption Dashboard.
Dashboards
Site User Dashboard worksheet
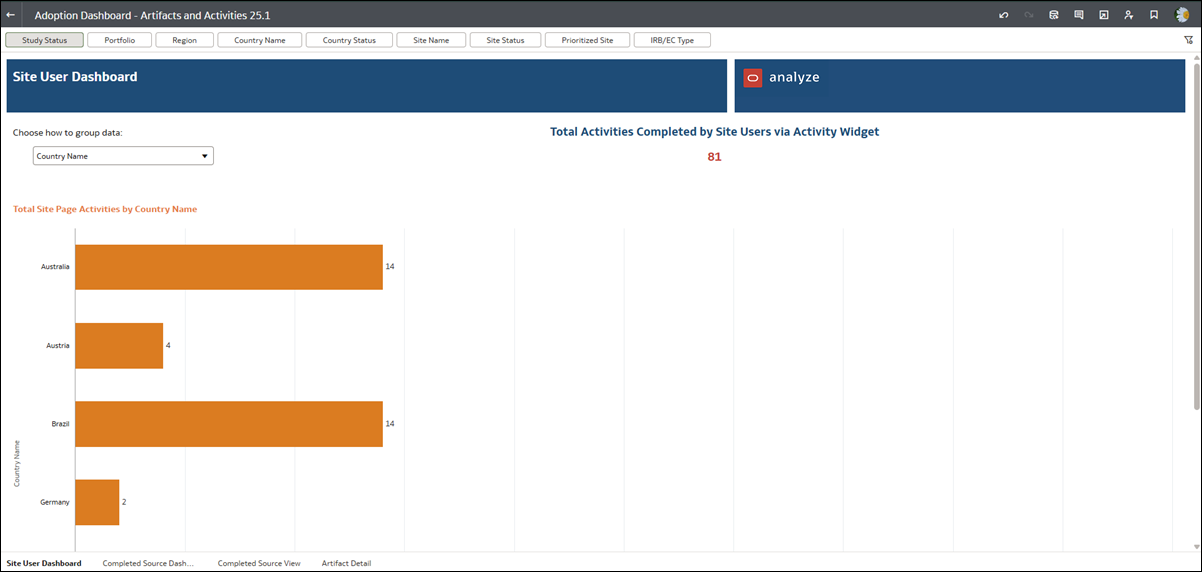
The Site User Dashboard includes a Total activities completed by site users via activity widget metric and a Total site page activities by region bar graph. You can refine the displayed data using filters above the worksheet.
Note:
Please refer to the Site User Dashboard included in the Adoption Dashboard report to see additional site metrics and visualizations. The Adoption Dashboard report’s Site User Dashboard includes metrics and visualizations for total site users, site user logins, and site user notes. Oracle maintains this information separately to ensure acceptable performance for both Adoption reports.

Completed Source Dashboard worksheet
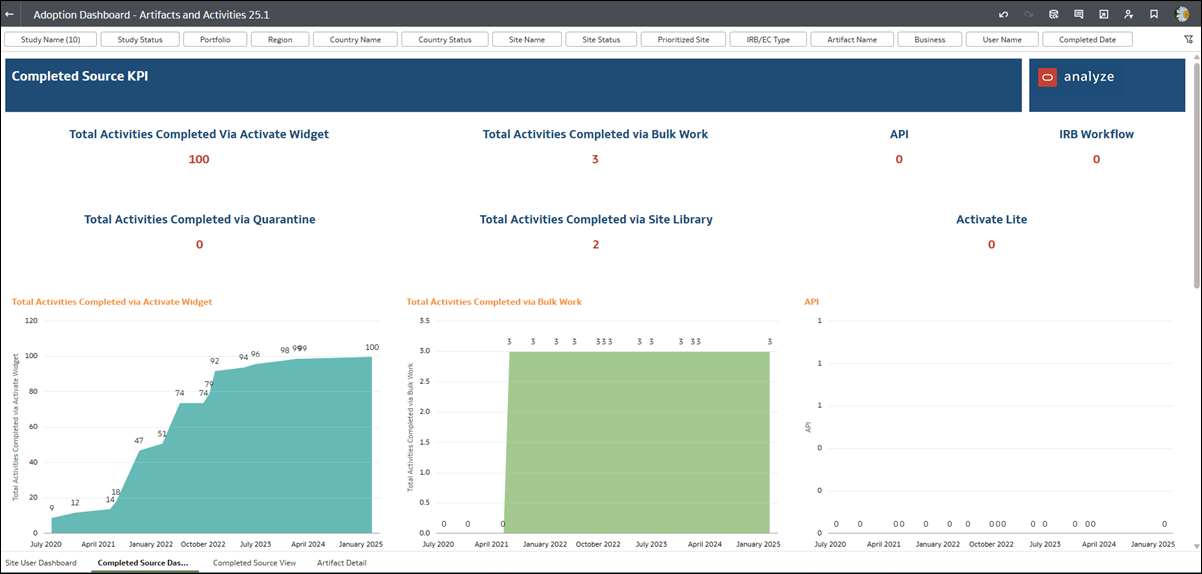
The Adoption Dashboard report also provides a way for you to evaluate how Oracle Site Activate users interact with the application, at the feature level. The “Completed Source Dashboard” worksheet includes the following top-level metrics:
- Total activities completed via Activate placeholder widget
- Total activities completed via Bulk Work
- Total activities completed via API
- Total activities completed via IRB workflow
- Total activities completed via quarantine
- Total activities completed via Site Library
- Total activities completed via Activate LITE
Below the metrics, the dashboard displays visualizations for each KPI listed above. Hover over any point in the visualizations to see details in a tool-tip.
Above the worksheet, select from additional filters to subset the dashboard data (e.g. Study Name, Study Status, Portfolio, Region, etc.). Filters for Site Name, Artifact Name, User Name, etc. allow you to create unique views of individual user interactions with the Oracle Site Activate application.

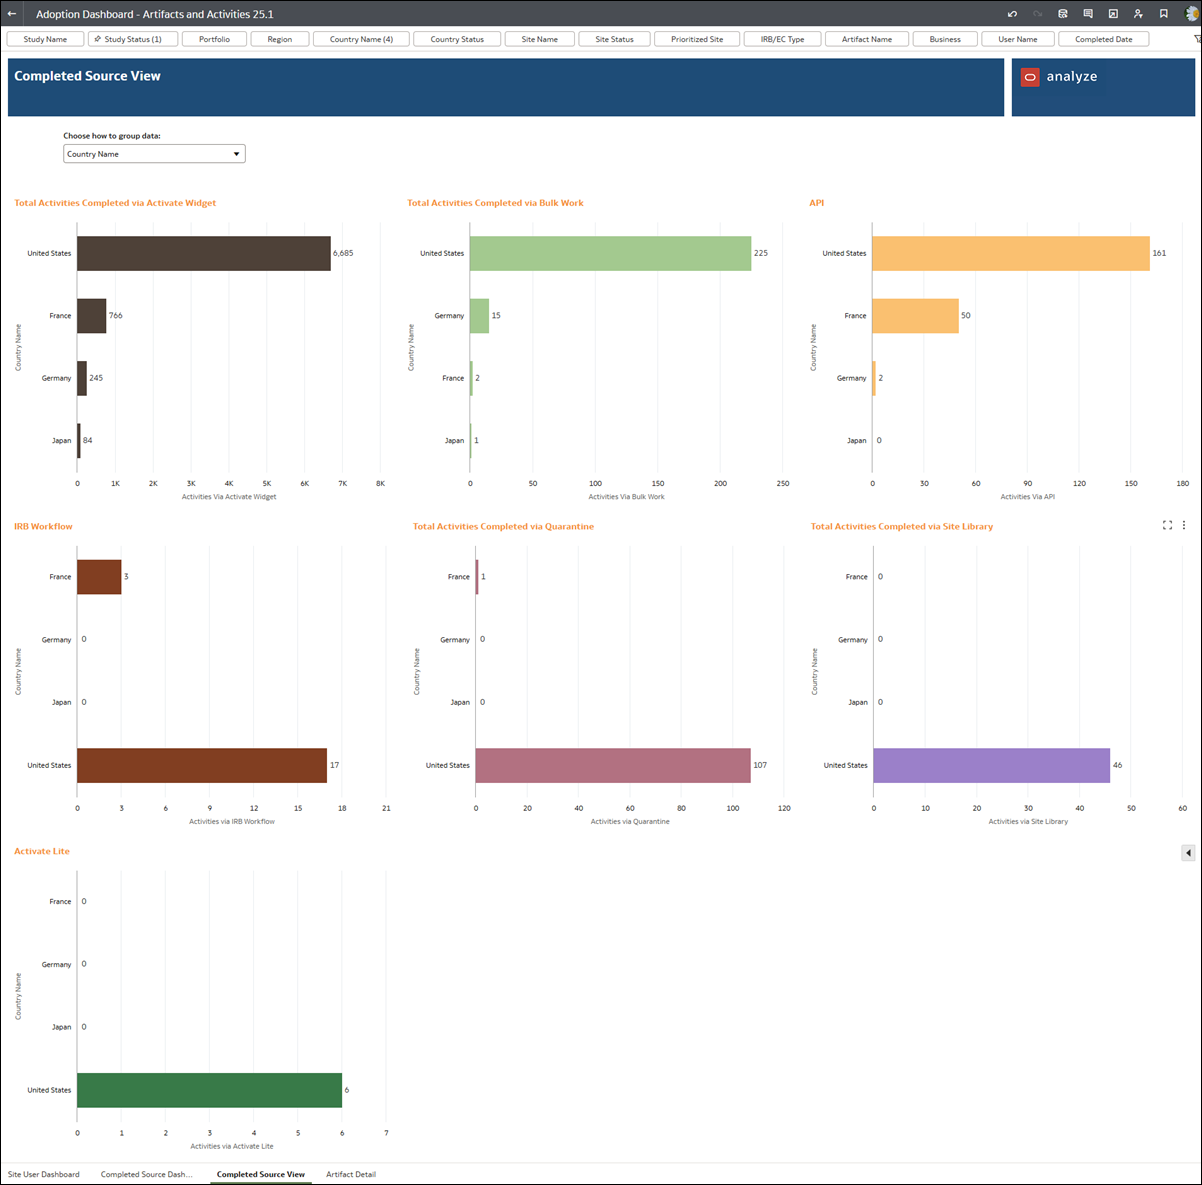
Completed Source View worksheet
- Portfolio
- Study
- Country
- Region
- Artifact
- User
- Business role
- Mastered PI

Artifact Detail worksheet
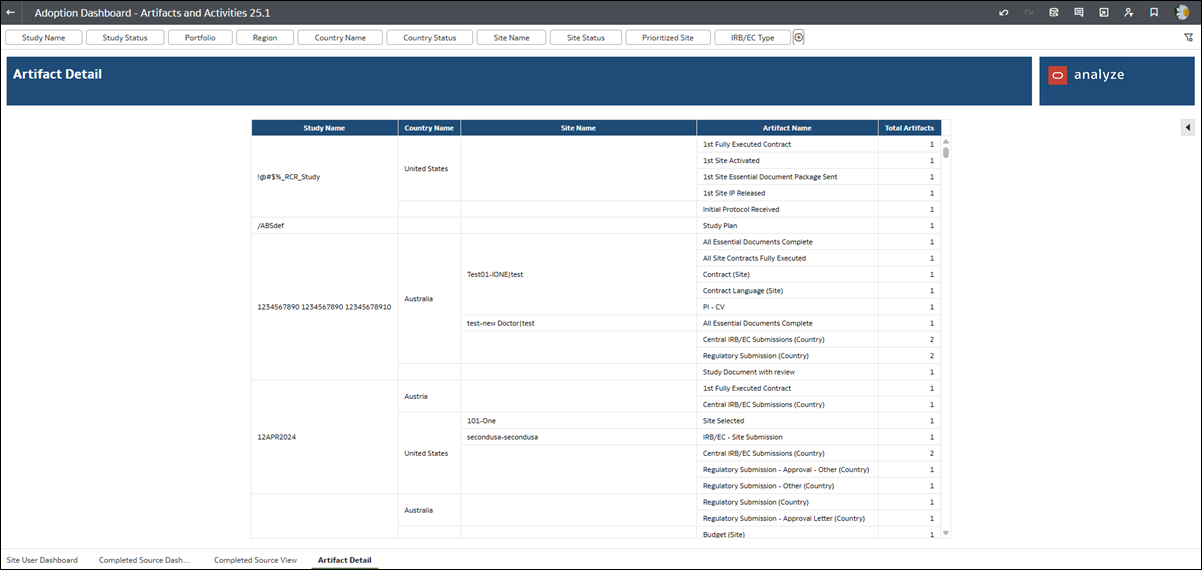
The Artifact Detail worksheet presents data in a tabular view. Use any of the filters displayed above the worksheet to subset the data as preferred.
