8 Size Profiles
This chapter describes the Size Profiles Cloud Service module.
Overview
The Size Profiles (SP) is a module under Retail Profile Sciences and is used to estimate the distribution of demand across different sizes (size profile) for different merchandise and location levels.
Size profile is estimated at different levels of merchandise and location. The lowest level of estimation is style-color (for merchandise) and store (for location). Size profiles may also be estimated at higher levels of aggregation on both the merchandise and location dimensions (for example, at subclass-store or style/color-region), depending on the retailer's requirements.
At a high level, the workflow for SP consists of creating a run, reviewing the size profiles, and submitting and approving them. The approved profiles are exported once the export process runs.
Navigation
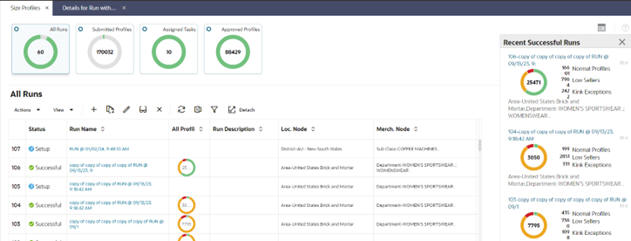
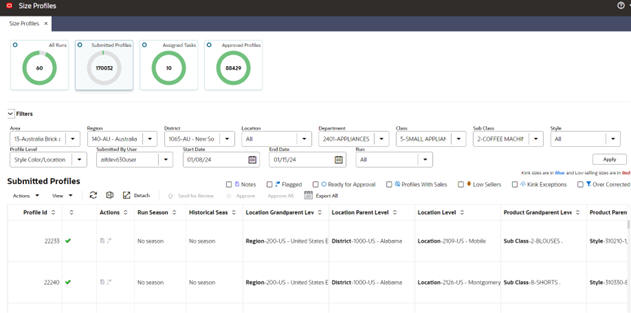
You can use the Info tiles at the top of the screen, shown in the following image, to navigate to:
-
All Runs, which displays all previously created runs and is where you can create new runs.
-
Submitted Profiles, which displays the submitted profiles across all runs. It is possible to have multiple submitted profiles for the same merchandise/location/attribute/size range/season from different runs.
-
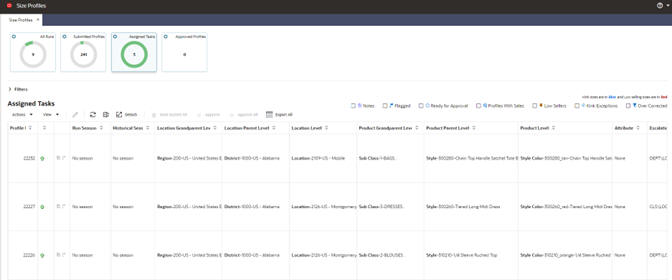
Assigned Tasks, which displays all profiles assigned to the user for review.
-
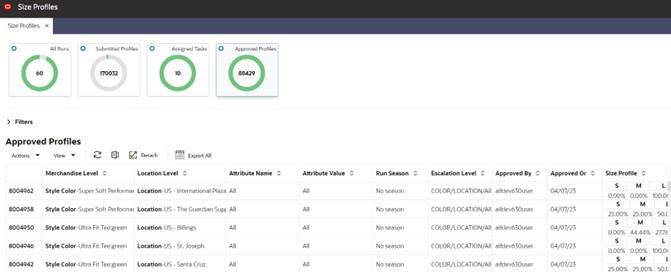
Approved Profiles, which displays the approved profiles that are already exported. Each merchandise/location/attribute/size range/season can have at most one approved profile.
All Runs
The All Runs screen lists all previously created runs, regardless of their status.
Click the Run Name with a status of Successful to see the size profiles as well as the inputs of that run. If the run is in Failed status, only the run inputs will be shown. If the run is in Setup status, the edit run pop-up opens.
The Recent Successful Run list is displayed in the contextual area on the right. You can also click a run in this list in order to open it.
Creating a Run
To estimate size profiles, you create a run and specify the settings to be used for the estimation. To begin the process, either click the Create icon at the top of the overview table or select a row in the overview table and click the Duplicate icon to duplicate a run. Then click the link of the duplicated run in Run Name column. In either case, the Create Run screen is displayed.
Figure 8-3 Create Run Showing Information Tab
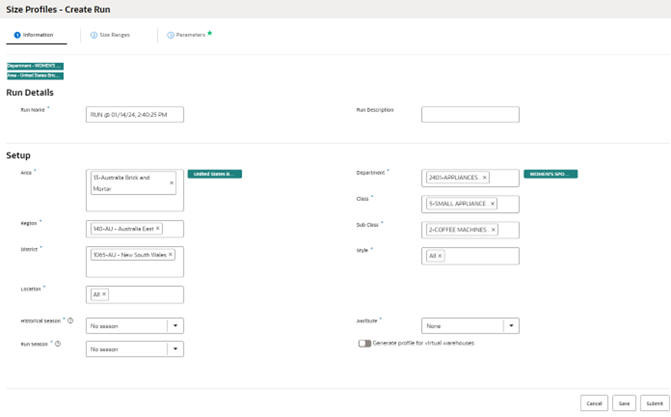
Description of "Figure 8-3 Create Run Showing Information Tab"
The Create Run screen has the following features:
-
Three tabs: the "Information Tab", the "Size Ranges Tab", and the "Parameters Tab".
-
The Save button, which saves the changes made in any of the tabs.
-
The Cancel button, which discards the changes in the current tab and closes the Create Run screen.
-
The Submit button, which saves all changes, begins the execution of the run, and closes the screen. At this point, the status of the run changes from Setup to In Progress.
-
The contextual area on the right, which displays a summary of user selections in each of the three tabs.
Information Tab
Use the Information tab, to provide the run name and description in the Run Details section. Use the selectors to select merchandise and location nodes that the size profile should be generated for. The highest/lowest level of selection and the lowest level that multi-select is allowed are controlled by global configurations. These configurations are explained in the Oracle Retail AI Foundation Cloud Services AI Foundation Implementation Guide.
Select the historical season to filter the historical data based on the start/end date of that season as well as limit the items to the ones that are mapped to that season. If item-season mapping is not available for a season, no data will be found for processing and no profiles will be generated. You can also select no season. In that case, the start/end of the historical period will be defaulted to the values indicated by SPO_NO_SEASON_START_DATE/ SPO_NO_SEASON_END_DATE in RSE_CONFIG. If those values are null, then the start/end of the historical period will be defaulted to the min/max weeks in the calendar hierarchy data (RSE_CAL_HIER table). In either case, you can override the start/end of historical period in the third tab of the Create Run screen.
In addition to the historical season, you can also select a run season. This is simply linking the run to the selected season. This is a feature which is used by the RMS Allocation system to link the profiles to the upcoming seasons.
If you want to use a product attribute in the escalation, select an attribute value. In the Parameters tab, you can set the escalation path as desired. Lastly, select the option for warehouse profiles, if desired.
Size Ranges Tab
A size range consists of a set of all available sizes for each style-color. For example, the size range for the style-color of Men's Pullover Black and Store of Boston Downtown is S, M, L, XL. The size range data is provided by the retailer.
Size range data is required for estimating the size profiles. Once you navigate from the Information tab to any of the other tabs, a process runs at the back end to extract size range data for the selected merchandise/location nodes and to populate relevant tables. This process can take some time to complete, depending on the size of data. You will see a pop-up message in the UI to indicate that the process is in progress. While the process is in progress, the merchandise/location filters will be disabled and cannot be modified. You can see the status of this process in the notifications on the left menu in the screen.
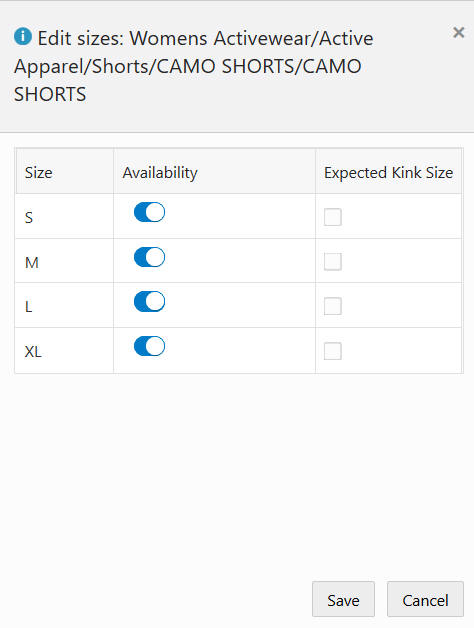
In the Size Ranges tab, shown in Figure 8-4, size range data is shown for each style-color and each store. If a certain size is not available in a size range, it will be shown as greyed out. If a size has been specified as an expected Kink Size (which means it is an odd size that may have significantly fewer or more sales than other sizes), it will be shown in blue.
Figure 8-4 Create Run Showing Size Ranges Tab
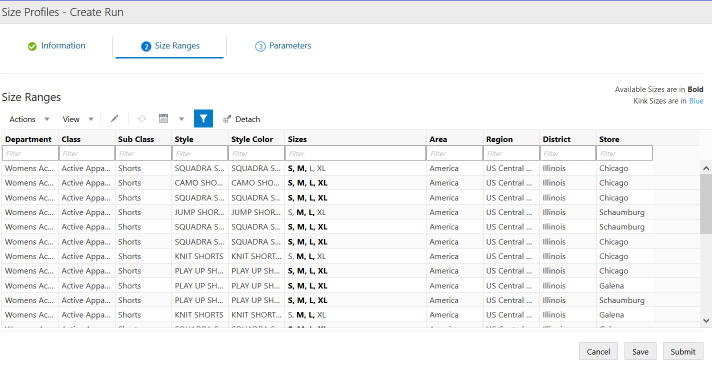
Description of "Figure 8-4 Create Run Showing Size Ranges Tab"
To edit the available sizes and kink size flags, select a row and click the Edit icon. This opens a pop-up, shown in Figure 8-5
Parameters Tab
The Parameters tab displays the parameters that are used by the size profile generation algorithm. The escalation path is used to cluster data and estimate profiles at different levels (that is, merchandise/location or merchandise/location/attribute) and find the optimal size profiles that best represent the expected demand pattern and is most robust to stock out periods, imbalanced stock across sizes and other factors. When a size profile at a given level of the escalation path does not meet the post-processing criteria, it automatically gets rejected and the size profile associated with a higher level is examined. This process continues until a valid size profile is fond at one of the levels along the escalation path.
The lowest level of the escalation path in a run defines the level of the profiles generated in that run. For example, if the escalation path consists of department-region, department-location, subclass-region, and subclass-location, the size profiles will be generated at subclass-location level, that is one profile for each subclass/location/size range. In addition, for all runs at any level, size profiles will also be generated at the lowest level (style-color/location).
The parameters of the size profiles estimation algorithm fall into two categories: pre-processing and post-processing.
You can edit the values for these parameters, as shown in Figure 8-6. The default values of the parameters are defined in SPO_DFLT_PARAMETER. You can modify the default values using the Manage System Configuration screen under the Control & Tactical Center. The table below shows the name, description, and default value of the parameters.
Figure 8-6 Create Run Showing Parameters Tab
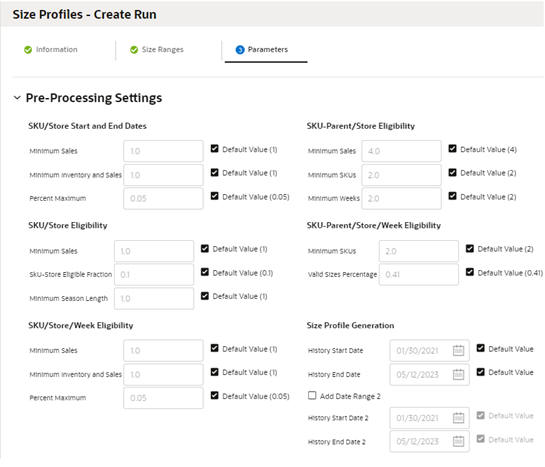
Description of "Figure 8-6 Create Run Showing Parameters Tab"
| PARAMETER_NAME | PARAMETER_TYPE | UI_PARAMETER_LABEL | PARAMETER_VALUE | DESCRIPTION |
|---|---|---|---|---|
| SPO_MIN_SALES | SKU/Store Start and End Dates | Minimum Sales | 1 | Minimum Sales for determining start and end dates. |
| SPO_MIN_INV_SALES | SKU/Store Start and End Dates | Minimum Inventory and Sales | 1 | Minimum Inventory and Sales for determining start and end dates. |
| SPO_PCT_MAX | SKU/Store Start and End Dates | Percent Maximum | 0.05 | Percent Maximum for determining start and end dates. |
| SPO_MIN_SALES_SKU_STR | SKU/Store Eligibility | Minimum Sales | 1 | Minimum Sales SKU-Store for determining SKU-Store Eligibility. |
| SPO_ELIG_FRACTION_SKU_STR | SKU/Store Eligibility | SKU-Store Eligible Fraction | 0.1 | Eligible Fraction SKU-Store for determining SKU-Store Eligibility. |
| SPO_MIN_SEASON_LEN_SKU_STR | SKU/Store Eligibility | Minimum Season Length | 1 | Minimum Season Length SKU-Store for determining SKU-Store Eligibility. |
| SPO_MIN_SALES_SKU_STR_WK | SKU/Store/Week Eligibility | Minimum Sales | 1 | Minimum Sales for determining SKU/Store/Week Eligibilit |
| SPO_MIN_INV_SALES_SKU_STR_WK | SKU/Store/Week | Minimum Inventory and Sales | 1 | Minimum Inventory and Sales for determining SKU/Store/Week Eligibility |
| SPO_PCT_MAX_SKU_STR_WK | SKU/Store/Week Eligibility | Percent Maximum | 0.05 | Percent Max SKU-Store-Week for determining SKU/Store/Week Eligibility |
| MIN_SLS_PRNT_STR_WK | SKU-Parent/Store Eligibility | Minimum Sales | 4 |
Minimum sales units for determining SKU-Parent/Store Eligibility. |
| MIN_SKUS_PRNT_STR_WK | SKU-Parent/Store Eligibility | Minimum SKUs | 2 | Minimum SKUs for determining SKU-Parent/Store Eligibility |
| MIN_WKS_PRNT_STR_WK | SKU-Parent/Store Eligibility | Minimum Weeks | 2 | Minimum Weeks for determining SKU-Parent/Store Eligibility |
| SPO_MIN_SKU_STR_WK | SKU-Parent/Store/Week Eligibility | Minimum SKUs | 2 | Minimum SKUs for determining SKU-Parent/Store Eligibility |
| SPO_PCT_SZ_RNG_PRNT_STR_WK | SKU-Parent/Store/Week Eligibility | Valid Sizes Percentage | 0.41 | Percent Size Range for determining SKU-Parent/Store Eligibility. |
| SPO_SZ_PRO_GEN_METHOD | Size Profile Generation |
Size Profile Generation Method |
Optimization | The size profile generation method (Optimization or Normalized). |
| SPO_SKU_PRNT_STR_WK | Postprocessing | Valid Sample Threshold | 2 | Post Processing threshold: Min number of SKU-parent/store/weeks with at least one valid sale. |
| SPO_TOT_UNIT_SLS | Postprocessing | Valid Sales units Threshold | 2 | Post Processing threshold: Min number of valid sales units that each size in the partition should have. |
| SPO_TOT_UNIT_SLS_PCT_SIZES | Postprocessing | Valid Sizes Percentage | 0.4 | Post Processing threshold: Min Percent of sizes. |
| SPO_SALE_PROF_CORR_THRESHOLD | Postprocessing | Threshold for correlation with Sales Profile | 0.9 | This parameter provides the correlation threshold between size profiles and sales profile. |
| SZ_PROF_OVER_CORR_THRESHOLD | Postprocessing | Threshold for size profiles compared with historical sales profile | 2 | Indicates size profiles are compared with historical sales profile and if the ratio between size profile and sales profile exceeds this value for at least one size, profile is flagged and is shown in UI under over-correction tile in run output |
| SPO_KINK_INNER_RATIO | Kink Size Analysis | Kink Inner Ratio | 1.1 | The default value for kink inner ratio. |
| SPO_KINK_OUTER_RATIO | Kink Size Analysis | Kink Outer Ratio | 1.03 | The default value for kink inner ratio. |
| SPO_CORR_LOW_SELL_FLG | Low Seller Correction | Correct Size Profiles for Low Sellers | Y | The flag (Yes or No) to indicate whether to apply post processing to correct size profiles of low sellers |
| SPO_LOW_SELL_AVG | Low Seller Correction | Average Weekly Sales of SKU | 1 | Average weekly sale units across a season, below which deems a SKU (Size) to be a low seller. |
| ENABLE_OVER_CORR_FILTER_FLG |
Postprocessing |
Enable size profiles over-correction filter flag | Y | Y/N flag which indicates whether the profiles that have over-correction should be removed during post-procesing (Y) or should be kept in the final set of profiles and just be flagged as over-corrected (N). |
Reviewing a Run
Once the run has completed successfully, you can use various options to filter the profiles and review the size profile output. You can also override and submit/un-submit size profiles.
Run Output
To open a run with a status of Complete, click the Run Name in either the All Runs table or from the list of recent runs. The Run Output screen opens in a new tab. This screen has two tabs, Size Profiles and Inputs.
Size Profiles Tab
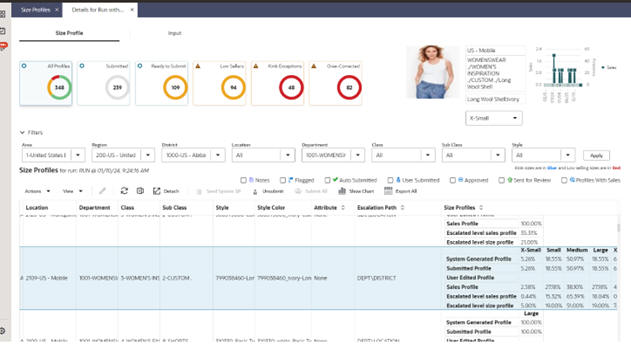
The Size Profiles tab displays the generated size profiles for each merchandise/location combination at the run level. You can filter the profiles based on their submitted and alert status using the five tiles at the top of the screen for All Profiles, Submitted, Ready to Submit, Low Sellers, Kink Exceptions, and Over-corrected.
Below the tiles, you can use the collapsible filter section to filter the size profiles based on the merchandise and location hierarchies. You can also use the check-box filters above the table to further filter profiles by status (auto/user, submitted, approved, sent for review) as well as profiles with notes/flag. Lastly, you can filter profiles to show/hide the profiles that had any sales during the historical period.
The size profiles table is multi-row selectable, using the Ctrl and Shift buttons. This table has the following columns:
-
The first column (with no header) shows the status of the profile. Values are user submitted (
 ), auto submitted (
 ), and approved.
-
The action column has the note and flag icons. Values are some notes have been added (
 ), no notes added
yet (
 ), flagged (
 ),
not flagged (
 ).
).
You can click on the note icon to view or edit the notes in a pop-up. You can also click the flag icon to flag or un-flag a size profile.
-
The columns that show the merchandise and location hierarchy (for example, Region, District, Location, Department, Class, Subclass, and so on) and another column to show attributes. If an attribute is not selected when setting up the run, this column will have value of None.
-
The escalation path that indicates the level at which the size profile has been generated.
The size profiles column that shows the following values:
-
System: the size profile generated by the system (using the estimation algorithm). This profile will be identical to the “escalated level size profile” unless the merchandise/location at the run level has fewer sizes than the merchandise/location at the escalation level. In that case the escalation level profile will be normalized based on the sizes available for the merchandise/location at the run level such that the system generated profile sums to 1.
-
User: the values edited by the user. If the user has not edited the values or has not seeded system values to populate user values, this row will be empty.
-
Approved: the approved values, if the size profile was approved. If the size profile has not been approved, this row will be empty.
-
Sales Profile: shows the profile of the observed sales (without correcting for the lost sales and any other post-processing) at the profile level.
-
Escalated level sales profile: shows the profile of the observed sales (without correcting for the lost sales and any other post-processing) at the escalation level.
-
Escalated level size profile: shows the estimated profile at the escalation level.
The following actions can be done in the Size Profiles table:
-
Seed the user values with the System size profile by selecting one, or multiple, rows and clicking on the Seed System SP button at the top of the table.
-
Edit a profile in the edit pop-up by selecting a single row and clicking on the Edit icon at the top of the table. If a size profile is submitted, edit is not allowed. To edit, the user must first un-submit the profile. The edit pop-up is shown in Figure 8-8. The edited values must sum up to 100 percent. If they do not, you will not be able to save. To normalize the values, you can use one of the two options (Normalize All or Normalize Edited). The first option adjusts all values so that they sum up to 100 percent. The second option adjusts only the edited values so that the sum of all the values becomes 100 percent. In the edit profile pop-up, you can also override the profile with the sales profile.
-
Submit or un-submit a profile by selecting one or multiple rows and clicking on the Submit/Un-submit button at the top of the table. Alternatively, use the Submit All button to submit all the profiles that match the selected filters.
-
Export the output to Excel using the export button above the table. This will export the profiles that match the selected filters. The maximum number of profiles that gets exported is controlled by the configuration SPO_UI_FETCH_SIZE in RSE_CONFIG. To export all profiles that match the selected filters, use the Export All button above the table. This option will export all the profiles even if number of them exceeds the configuration SPO_UI_FETCH_SIZE. In that case the export process may take longer and user will be notified once the process is complete and the Excel file is downloaded.
-
View and edit the notes on each profile using the Note icon in the Action column, which opens a pop-up.
-
Flag or un-flag a profile by clicking on the Flag icon in the Action column.
-
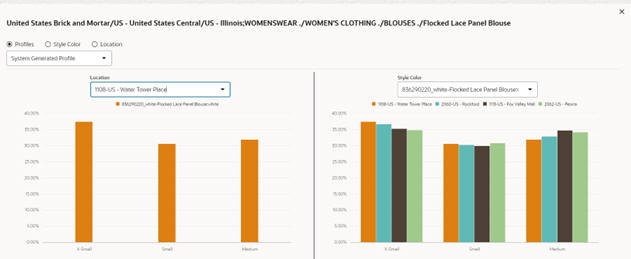
View the graphs for each profile by selecting a row and clicking the “Show Chart” button above the table. This will open the pop-up that is shown in **INTERNAL XREF ERROR**. There are three different views:
-
Profiles view: In this view on the left side you can see the profiles of multiple merchandise nodes (at the run level) for a specific location node (at the run level). Similarly, on the right side you can see the profiles of multiple location nodes (at the run level) for a specific merchandise node (at the run level).
-
Merchandise view (for example style-color): In this view you can see the system profile, sales profile and user profile for the selected profile merchandise and the location that is selected from the drop-down list.
-
Location view (for example region): In this view you can see the system profile, sales profile and user profile for the selected profile location and the merchandise that is selected from the drop-down list.
-
-
View the weekly sales and inventory and product image at the top of the screen for a selected row in the table. This view is available only for the runs that are at lowest level (style-color/location).
Note:
If a profile (for a given merchandise/location/attribute/size range) has already been approved or sent for review, the seed, submit/un-submit, and edit actions are not available. None of these actions can be performed for the profile. Note and flag can still be modified.
Submitted Profiles
You can see the submitted profiles across all runs in the Submitted Profiles screen, shown in **INTERNAL XREF ERROR**. You can send profiles for review to your own user or another user. You can approve selected profiles or bulk approve all profiles. The approved profiles will get exported out once the nightly export process runs.
The Filters section is similar to the filters in the Run Output screen. You can use it to filter the size profiles based on product and location hierarchies. Using the profile level filter, you can view either the profiles at lowest level (style-color/location) or the profiles at higher levels. Using the user filter, you can filter the profiles based on the user who submitted the. Using the date filters, you can filter the profiles based on the date that they were submitted. Using the run filter, you can limit the profiles to a certain run. You can also use the check-box filters above the table to further filter profiles by ready for approval status, as well as having notes or flags. Lastly, you can filter profiles to show/hide the profiles that had any sales during the historical period, are low sellers, have kink exception, or have over-correction alert.
Approved Profiles
In the approved profiles screen, shown in Figure 8-11, you can view approved profiles across all runs.
The Filters section is the same as the one in the Run Output screen. You can use it to filter the size profiles based on product and location hierarchies. You can also use the check-box filters above the table to filter profiles by status (auto/user approved, submitted, and sent for review) as well as a notes/flag.
Submitted Profiles Table
The submitted profiles table is multi-row selectable, using the Ctrl and Shift buttons. This table has the following columns:
-
The first column (with no header) shows the status of the profile: Value are user submitted (
 ), auto submitted
(
 ), approved (
 ), sent for review (
 ).
).
-
The action column has the note and flag icons. Values are some notes have been added (
 ), no notes added
yet (
 ), flagged (
 ),
not flagged (
 ).
).
-
You can click on the Note icon to view or edit the notes in a pop-up. You can also click the Flag icon to flag or un-flag a size profile.
-
The run season and historical seasons are the values that are selected when the run was created.
-
Columns that show three levels of hierarchy for the merchandise and location of the profile. For example, if the profile is at style-color/location level, the three location hierarchy columns will show the region, district and location. The three merchandise hierarchy columns will show the subclass, style and style-color. Note that the submitted profiles can belong to different runs with different levels. Therefore, the profiles in submitted table are not necessarily at the same level.
-
Attribute columns that show the attribute that was selected when creating the run. If attribute was not selected when setting up the run, this column will have value of None.
-
The escalation path that indicates the level at which the size profile has been generated.
-
Submitted by, Submitted on, and Run (on which the profile was submitted).
-
Size profiles shows the submitted profile.
The following actions can be performed in this screen:
-
View and edit the notes on each profile, using the Note icon in the Action column that opens a pop-up.
-
Flag or un-flag a profile by clicking on the Flag icon in the Action column.
-
Send a profile for review to own user or another user, using the Send for Review button above the table. It will open a pop-up in which you can select the reviewer role.
-
Approve the profile by selecting one or multiple profiles and using the Approve button above the table. To approve all profiles that match the selected filters, use the Approve All button. The approved profiles will be exported out once the nightly or ad-hoc export process runs. .
Note:
Once a profile is approved, it will no longer be shown in the submitted profiles screen and table. It will be only available to see in the Approved Profiles screen after the export process runs. -
Export the output to Excel using the export button above the table. This will export the profiles that match the selected filters. The maximum number of profiles that gets exported is controlled by the configuration SPO_UI_FETCH_SIZE in RSE_CONFIG. To export all profiles that match the selected filters, use the Export All button above the table. This option will export all the profiles even if number of them exceeds the configuration SPO_UI_FETCH_SIZE. In that case the export process may take longer and user will be notified once the process is complete and the Excel file is downloaded.
Assigned Tasks
In the Assigned Tasks screen, shown in Figure 8-12, you can see any profile that has been assigned to your user for review.
The filters section is similar to the filters in the Run Output screen. You can use it to filter the size profiles based on product and location hierarchies. Using the profile level filter, you can view either the profiles at lowest level (style-color/location) or the profiles at higher levels. You can also use the check-box filters above the table to further filter profiles by ready for approval status, as well as having notes or flags. Lastly, you can filter profiles to show/hide the profiles that had any sales during the historical period, are low sellers, have kink exception, or have over-correction alert.
Assigned Tasks Table
The assigned tasks table is multi-row selectable using the Ctrl and Shift buttons. This table has the following columns:
-
The first column (with no header) shows the status of the profile: Values are user submitted (
 ) and auto submitted
(
 ).
).
-
The action column has a note icon and a flag icon. Values are some notes have been added (

-
You can click on the Note icon to view or edit the notes in a pop-up. You can also click the Flag icon to flag or un-flag a size profile.
-
Columns that show three levels of hierarchy for the merchandise and location of the profile. For example, if the profile is at style-color/location level, the three location hierarchy columns will show the region, district and location. The three merchandise hierarchy columns will show the subclass, style and style-color. Note that the submitted profiles can belong to different runs with different levels. Therefore, the profiles in submitted table are not necessarily at the same level.
-
Attribute column to show the attribute that was selected when creating the run. If attribute was not selected when setting up the run, this column will have value of None.
-
The escalation path which indicates the level at which the size profile has been generated.
Size profiles chart that shows the following values:
-
System: the size profile generated by the system (using estimation algorithm)
-
User: the values edited by the user. Initially this row shows the values edited by the sender user (if any edits has been made).
-
Submitted: the values that were submitted by the sender user.
-
Sales Profile: shows the profile of the observed sales (without correcting for the lost sales and any other post-processing).
The following actions can be performed in this screen:
-
Seed the user values with System size profile, by selecting one or multiple rows and clicking on the Seed System SP button at the top of the table.
-
View and edit the notes on each profile, using the Note icon in the Action column that opens a pop-up.
-
Flag or un-flag a profile by clicking on the Flag icon in the Action column.
-
Edit a profile in the edit pop-up, by selecting a single row and clicking on the Edit icon at the top of the table.
-
Approve the profiles by selecting one or multiple profiles and using the Approve button above the table. To approve all profiles that match the selected filters, use the Approve All button. The approved profiles will be exported out once the nightly or ad-hoc export process runs.
Note:
Once a profile is approved, it will no longer be shown in the assigned tasks screen and table. It will be only available to see in the Approved Profiles screen after the export process runs. -
Export the output to Excel using the export button above the table. This will export the profiles that match the selected filters. The maximum number of profiles that gets exported is controlled by the configuration SPO_UI_FETCH_SIZE in RSE_CONFIG. To export all profiles that match the selected filters, use the Export All button above the table. This option will export all the profiles even if number of them exceeds the configuration SPO_UI_FETCH_SIZE. In that case the export process may take longer and user will be notified once the process is complete and the Excel file is downloaded.
Approved Profiles
In the Approved Profiles screen, you can see the profiles that have been approved. the approved profiles are exported to different flat files during the nightly batch or whenever the ad hoc process for export is executed. The profiles are shown in the Approved Profiles screen only after the export is completed. For details of different export files refer to the Oracle Retail AI Foundation Cloud Services: AI Foundation Implementation Guide.
Figure 8-13 Approved Profiles
Useful Tables and Views
The following table/views can be accessed and queried in Innovation Workbench and provide useful information about the input data or run outputs.
- SPO_RUN_METRIC: provides statistics of retained data after each stage of pre-processing. For example if too much of sales volume is being filtered after a certain stage of pre-processing, it can be an indication of the pre-processing parameters being too restrictive for that stage. It will be useful to do additional runs with more relaxed values for the parameters and compare the profiles and run metrics between the two runs.
- SPO_STYLE_DUP_DIFF_GRP_VW: provides the style-colors having more than one size range. This is considered invalid data and will require review of data in the source system.

