Affinity Analysis Overview
The Affinity Analysis Overview screen provides the tools in the following images. In addition to the standard application functionality, you can also
-
Select from the following functionality using the Action drop-down menu:
-
Create Custom run
-
Delete
-
Refresh
-
Add to Baseline Set
-
Add to Comparison Set
-
-
Select the type of run to view in this screen: User-Run, System-Run, or all runs.
Figure 7-10 Affinity Analysis Overview Functionality
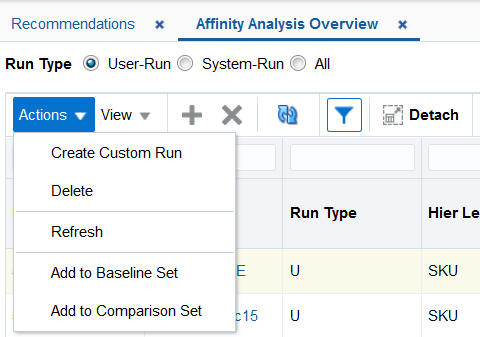
Description of "Figure 7-10 Affinity Analysis Overview Functionality"
The Affinity Analysis Overview table, shown in the following figure, displays the list of completed runs and contains the following fields.
Figure 7-11 Affinity Analysis Overview Table

Description of "Figure 7-11 Affinity Analysis Overview Table"
Table 7-16 Affinity Analysis
| Field Name | Description |
|---|---|
|
Batch ID |
Identifies the run. |
|
Run Name |
User-provided name for the run. |
|
Run Type |
U = User -Run; S = System-Run. |
|
Hier Level |
Hierarchy level. |
|
Batch Status |
Indicates the status of the run. Helps to determine if the run has completed, encountered any errors, or has not yet completed. |
|
Created By |
User name of person who created the run. |
|
Created |
Date when run created. |
|
Updated |
Date when run last updated. |
|
From |
Beginning date for run data collection. |
|
To |
Ending date for run data collection. |
|
Promo Detail |
Y indicates that the market basket affinities between different subclasses are displayed when the antecedent (if) components are promoted and the consequent (then) components are not promoted. N indicates that no consideration is given to whether or not the items are promoted. |
|
Location Ext Code |
The numeric identifier for the location. |
|
Location |
The external identifier for the location. |
|
Customer Seg Ext Code |
The external identifier for the customer segment. |
|
Customer Segment |
The name of the customer segment which the results are for. Values include Soccer Mom, Simply Seniors, Value Seekers, Gourmet Shoppers, Livin Large. |
|
Transaction Count |
Total number of transactions processed for this run. |
|
Total Sales Amount |
Total sales amount processed for this run. |
|
Total Sales Profit Amount |
Total sales profit amount processed for this run. |
|
Total Sales Quantity |
Total sales quantity processed for this run. |
When you click on a specific Run Name, you see a pop-up that displays Filter Results and Affinities Search Results.
Filter Results
The following figure shows the Filter Results and Affinities Search Results, which are displayed when you click on a specific Run Name. The fields are described in following tables. Search button to initiate the filtering process and use the Reset button to clear the filter fields.
Figure 7-12 Filter Results and Affinities Search Results Table
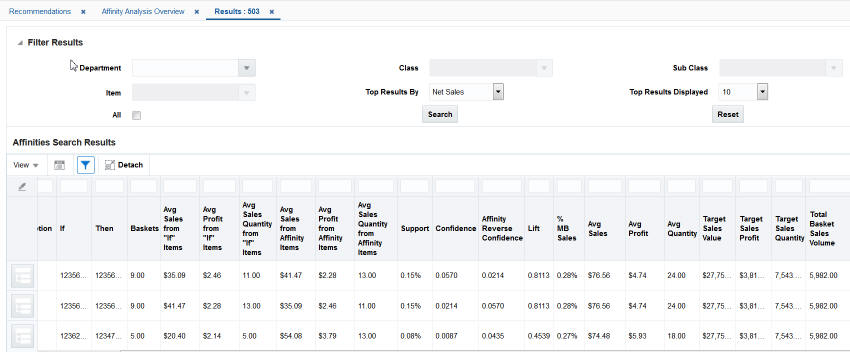
Description of "Figure 7-12 Filter Results and Affinities Search Results Table"
The following table describes the options you can use to filter the results that will be displayed.
Table 7-17 Filter Results
| Field | Description |
|---|---|
|
Department |
Select one or more departments for which the results should be filtered. |
|
Item |
Select the item within the department from the drop-down list. |
|
All |
Select to prevent any other filters from being used. |
|
Class |
Select one or more classes for which the results should be filtered. |
|
Top Results By |
Select a metric to see the top results by: Net Sales, Net Quantity, of Net Profit. |
|
Sub Class |
Select one or more subclasses for which the results should be filtered. |
|
Top Results Displayed |
Select a value (10, 20, 30...970, 980) to limit the number of results displayed. |
Affinities Search Results
The Affinities Search Results section of the pop-up provides details about the observed associations (affinities) between sales transactions. It is expressed as "If a customer buys X, then that customer may also buy Y." The table describes the relevant values associated with the If/Then transactions and contains the following fields:
Table 7-18 Affinities Search Results
| Field | Description |
|---|---|
|
Customer Segment |
(Customer Segment screen only) Displays the customer segment for which the product affinity was found. |
|
Promotion |
(All affinities screen only) Displays whether the rule represents IF components that were on promotion. |
|
If |
Displays the classes or subclasses containing items that were purchased in the market baskets for a given product affinity. All market baskets that contributed to a rule will contain items from these product categories. |
|
Then |
Displays the class or subclass that was found to have an affinity with the IF components of the market basket rule. |
|
Baskets |
The number of market baskets that contain items from both the IF and THEN components of the rule. |
|
Avg Sales from "If" Items |
The average sales retail amount from items belonging to the IF classes or subclasses. |
|
Avg Profit from "If" Items |
The average sales profit from items belonging to the IF classes or subclasses. |
|
Avg Sales Quantity from "If" Items |
The average sales units from items belonging to the IF classes or subclasses. |
|
Avg Sales from Affinity Items |
The average sales retail amount from items belonging to the THEN class or subclass. |
|
Avg Profit from Affinity Items |
The average sales profit from items belonging to the THEN class or subclass. |
|
Avg Sales Quantity from Affinity Items |
The average sales units from items belonging to the THEN class or subclass. |
|
Support |
The percent of market baskets that contain items from the IF and THEN components of the rule. |
|
Confidence |
The ratio of the number of transactions where the entire rule is present, compared to all transactions containing IF items. |
|
Affinity Reverse Confidence |
The ratio of the number of transactions where the entire rule is present, compared to all transactions containing THEN items. |
|
Lift |
A statistical measure of how strong the product affinity is, as compared to random chance for the rule (higher is better). |
|
% MB Sales |
The percent of total sales retail amount that the rule represents. |
|
Avg Sales |
The average weekly sales retail amount for the IF and THEN items in the rules. |
|
Avg Profit |
The average weekly sales profit for the IF and THEN items in the rules. |
|
Avg Quantity |
The average weekly sales units for the IF and THEN items in the rules. |
|
Target Sales Value |
The average weekly total sales retail amount across all transactions in the selected periods. |
|
Target Sales Profit |
The average weekly total sales profit across all transactions in the selected periods. |
|
Target Sales Quantity |
The average weekly total sales units across all transactions in the selected periods. |
|
Total Basket Sales Volume |
The average weekly transaction count across all transactions. |
Results Pop-up
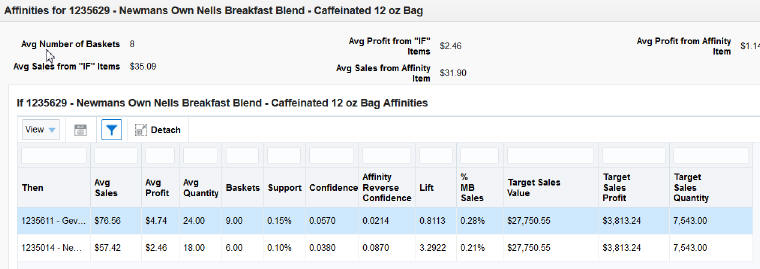
Click the right-hand icon for a specific row in the Results table to see If/Then Affinities for...pop-up. The pop-up shows all the other rules that have been discovered for the same If item. You can use this to compare the rules. In this way, you may discover another product with a stronger affinity for the item.
The pop-up has the following fields.
Table 7-19 Affinities For
| Field | Description |
|---|---|
|
Avg Number of Baskets |
The average number of baskets across the runs for the combination of the If and Then items. |
|
Avg Sales from "If" Items |
The average sales retail amount from items belonging to the IF classes or subclasses. |
|
Avg Profit from "If" Items |
The average sales profit from items belonging to the IF classes or subclasses. |
|
Avg Sales from Affinity Item |
The average sales retail amount from item belonging to the THEN class or subclass. |
|
Avg Profit from Affinity Item |
The average sales retail amount from item belonging to the THEN class or subclass. |
|
Then |
Displays the class or subclass that was found to have an affinity with the IF components of the market basket rule. |
|
Avg Sales |
The average weekly sales retail amount for the IF and THEN items in the rules. |
|
Avg Profit |
The average weekly sales profit for the IF and THEN items in the rules. |
|
Avg Quantity |
The average weekly sales units for the IF and THEN items in the rules. |
|
Baskets |
The number of market baskets that contain items from both the IF and THEN components of the rule. |
|
Support |
The percent of market baskets that contain items from the IF and THEN components of the rule. |
|
Confidence |
The ratio of the number of transactions where the entire rule is present, compared to all transactions containing IF items. |
|
Affinity Reverse Confidence |
The ratio of the number of transactions where the entire rule is present, compared to all transactions containing THEN items. |
|
Lift |
A statistical measure of how strong the product affinity is, as compared to random chance for the rule (higher is better). |
|
% MB Sales |
The percent of total sales retail amount that the rule represents. |
|
Target Sales Value |
The average weekly total sales retail amount across all transactions in the selected periods. |
|
Target Sales Profit |
The average weekly total sales profit across all transactions in the selected periods. |
|
Target Sales Quantity |
The average weekly total sales units across all transactions in the selected periods. |
Panel
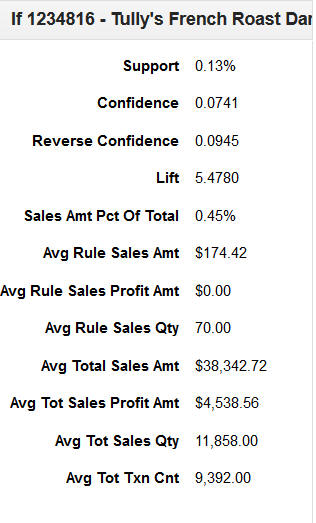
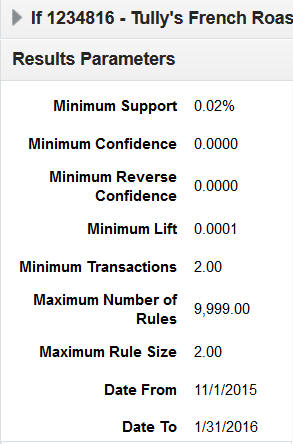
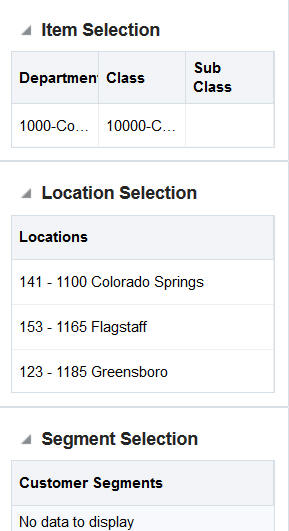
The side panel has two sections. To display the side panel, you must first select a row in the table. The top section reports some of the most useful values that are also displayed in the table. The bottom section explains the details regarding the run you are reviewing.
