Compare Results
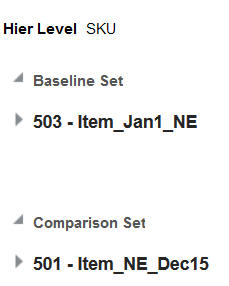
To compare results, select the two runs you want to compare. Highlight one run and click Add to Baseline Set. Highlight the second run and click Add to Comparison Set. You see these selections in the Compare Results right panel.
Click View to see the comparison. the View Results pop-up displays, which can be filtered by a combination of Department Item, Class, Top Results By, Subclass, and Top Results Displayed.
The results are displayed as a pair of rows for each item, a baseline row followed by a comparison row.
Table 7-20 Compare Results
| Field | Description |
|---|---|
|
If |
Displays the classes or subclasses containing items that were purchased in the market baskets for a given product affinity. All market baskets that contributed to a rule will contain items from these product categories. |
|
Then |
Displays the class or subclass that was found to have an affinity with the IF components of the market basket rule. |
|
Set |
Indicates whether the row of data is for the baseline runs or the comparison runs. |
|
Set Size |
The number of Item/Then components in the affinity rule. For example, "If Coffee and Creamer Then Sugar" has a Set Size of 3. |
|
Baskets |
The number of market baskets that contain items from both the IF and THEN components of the rule. |
|
Avg Sales from Affinity Items |
The average sales retail amount from items belonging to the THEN class or subclass. |
|
Avg Profit from Affinity Items |
The average sales profit from items belonging to the THEN class or subclass. |
|
Avg Sales Quantity from Affinity Items |
The average sales units from items belonging to the THEN class or subclass. |
|
Avg Sales from "If" Items |
The average sales retail amount from items belonging to the IF classes or subclasses. |
|
Avg Profit from "If" Items |
The average sales profit from items belonging to the IF classes or subclasses. |
|
Avg Sales Quantity from "If" Items |
The average sales units from items belonging to the IF classes or subclasses. |
|
Support |
The percent of market baskets that contain items from the IF and THEN components of the rule. |
|
Confidence |
The ratio of the number of transactions where the entire rule is present, compared to all transactions containing IF items. |
|
Affinity Reverse Confidence |
The ratio of the number of transactions where the entire rule is present, compared to all transactions containing THEN items. |
|
Lift |
A statistical measure of how strong the product affinity is, as compared to random chance for the rule (higher is better). |
|
% MB Sales |
The percent of total sales retail amount that the rule represents. |
|
Avg Sales |
The average weekly sales retail amount for the IF and THEN items in the rules. |
|
Avg Profit |
The average weekly sales profit for the IF and THEN items in the rules. |
|
Avg Quantity |
The average weekly sales units for the IF and THEN items in the rules. |
|
Target Sales Value |
The average weekly total sales retail amount across all transactions in the selected periods. |
|
Target Sales Profit |
The average weekly total sales profit across all transactions in the selected periods. |
|
Target Sales Quantity |
The average weekly total sales units across all transactions in the selected periods. |
|
Total Basket Sales Volume |
The average weekly transaction count across all transactions. |
