Approving Pack Configurations
Runs can be reviewed for approvals and can be filtered based on provided Product, Calendar, and Location filters as well as Query by Example filters.
Figure 14-17 Approve Pack Configuration
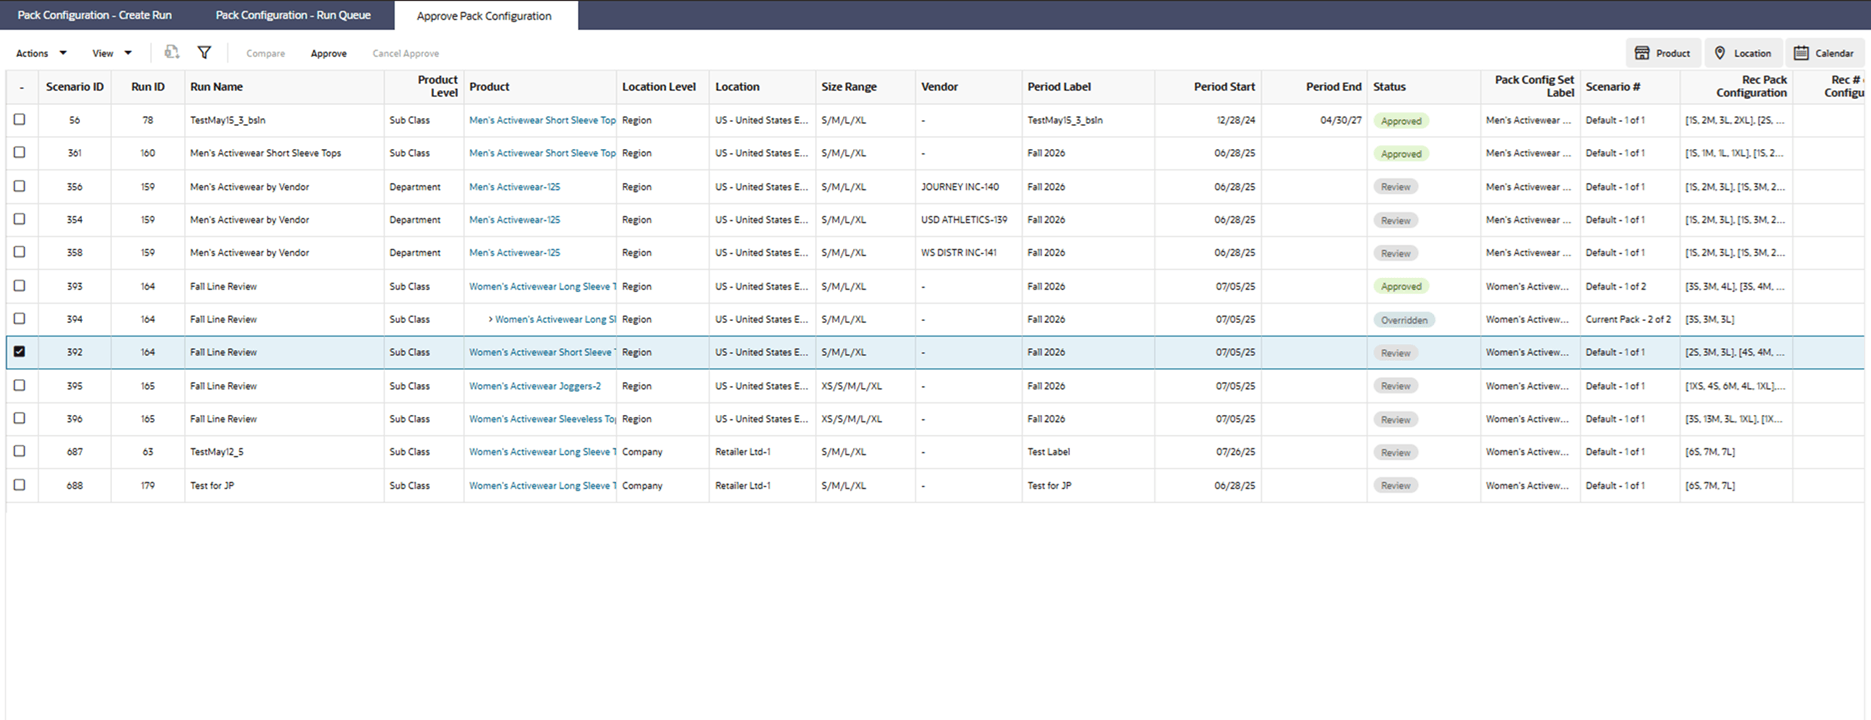
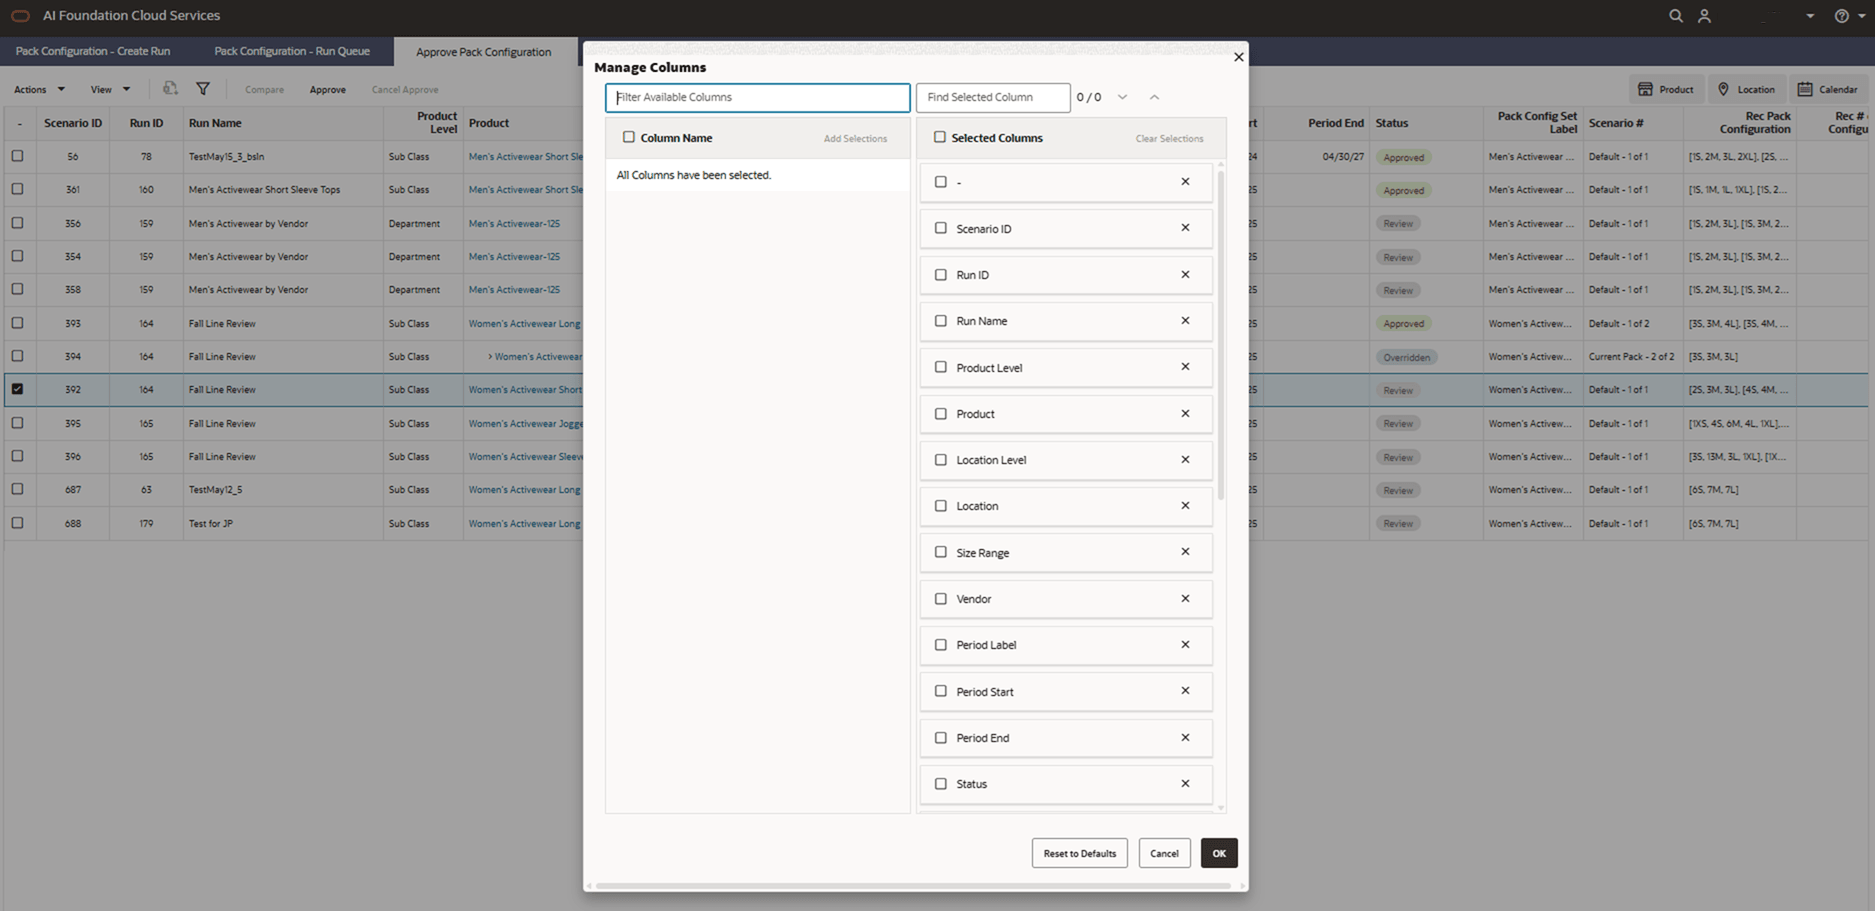
Users can review the recommended pack configurations and key related metrics. Columns can be hidden or reordered by selecting the View and Manage Columns.
Figure 14-18 View and Manage Columns
Note, if multiple scenarios exist for the same Product/Location/Sizerange/Vendor, the scenarios are automatically sorted such that the system recommended scenario is displayed at the top.
Below is a description of the metrics seen in the Approval table:
| Column Label | Detailed Description |
|---|---|
| Product Level | Product Level at which Pack Configurations are generated. |
| Product | Product Name |
| Location Level | Location Level at which Pack Configurations are generated. |
| Location | Location Name |
| Pack Configuration Set Label | Pack Configuration Set Label (User provided or system auto generated). |
| Size Range | Size Range Name |
| Vendor | Vendor |
| Status | Scenario Status |
| Scenario # | Scenario number |
| Rec Pack Configuration | Recommended Optimal Pack Configurations |
| Rec # of Pack Configurations | Recommended Optimal Number of Pack Configurations |
| Net Objective Cost diff Baseline | Net Objective Cost Difference to baseline pack configurations. This metric helps quantify the benefits from systems recommended pack configurations compared to the baseline pack configurations. Typically either last approved packs or scenarios with fixed pre packs are selected as baseline scenarios when runs are submitted. |
| Rec # of Eaches | # of eaches needed to meet total demand based on system recommended packs, as simulated by the system. If “Enable Eaches” is set to False when creating the run, this value will be 0. Includes heldback need if “fill heldback need with eaches" is Y. |
| Rec # of Allocated Packs | # of packs needed to meet total demand based on system recommended pack configurations, as simulated by the system. |
| Total Demand Sourced | This is the Total Demand that was used to determine the optimal pre-pack configurations. SKU/Store level demand is used to determine the optimal pack configurations, based on the Demand Source and weeks specified. The number presented here is an aggregation of this demand at the optimization level. Includes heldback need if “fill heldback need with eaches" is Y. |
| Over Allocated Unit % | Units Over Allocated/Total Demand Units as simulated by the system. The over allocated units are computed at the store level and aggregated up. |
| Under Allocated Unit % | Units Under Allocated/Total Demand Units as simulated by the system. The under allocated units are computed at the store level and aggregated up. |
| Incremental Mis Allocated Unit % | Increment in misallocation units, compared to only distributing Eaches. Misallocations from Eaches arises from fractional need at the size level and cannot be avoided. Hence this metric represents the additional misallocations from the packs. |
| Over Allocated Unit Cost | Simulated Under Allocation costs divided by Total Demand Sourced. Under Allocation cost is computed as Total Units Under Allocated * under allocation cost factor. |
| Under Allocated Unit Cost | Over Allocation costs divided by Total Demand Sourced. Over Allocation cost is computed as Total Units Over Allocated * over allocation cost factor. |
| Mis Allocated Unit Cost | Misallocation Cost (Over + Under Allocation costs) divided by Total Demand Sourced |
| Net Objective Unit Cost | Total cost (Misallocation + Distribution Cost) minimized by the Optimizer divided by Total Demand Sourced. When comparing scenarios, a lower Net Objective cost per Unit is better. |
| Baseline Rec # of Pack Configurations | # of Pack Configurations simulated as baseline. When runs are submitted, any one scenario can (optionally) be specified as a baseline. The results from this scenario are used as a basis for comparing all other scenarios. Typical expected usage is that either last approved packs or scenarios with fixed pre packs are selected as baseline scenarios. If no scenario is selected as Baseline, then all Baseline metrics will be empty. |
| Baseline Rec # of Eaches | # of eaches needed to meet total demand based on baseline pack configurations, as simulated by the system. If “Enable Eaches” is set to False when creating the run, this value will be 0. |
| Baseline Rec # of Allocated Packs | # of packs needed to meet total demand based on baseline pack configurations, as simulated by the system. |
| Baseline Over Allocated Unit % | Units Over Allocated/Baseline Total Demand Units as simulated by the system for baseline pack configurations. The over allocated units are computed at the store level and aggregated up. |
| Baseline Under Allocated Unit % | Units Under Allocated/Total Demand Sourced Units as simulated by the system for baseline pack configurations. The under allocated units are computed at the store level and aggregated up. |
| Baseline Incremental Mis Allocated Unit % | Increment in misallocation units when distributing baseline pack configurations, compared to only distributing Eaches. Misallocations from Eaches arises from fractional need at the size level and cannot be avoided. Hence this metric represents the additional misallocations from the baseline packs. |
| Baseline Over Allocated Unit Cost | Under Allocation costs with baseline pack configurations divided by Total Demand Sourced. Under Allocation cost is computed as Units Under Allocated * under allocation cost factor. |
| Baseline Under Allocated Unit Cost | Over Allocation costs with baseline pack configurations divided by Total Demand Sourced. Over Allocation cost is computed as Units Over Allocated * under allocation cost factor. |
| Baseline Mis Allocated Unit Cost | Misallocation Cost (Baseline Over + Baseline Under Allocation costs) with baseline pack configuration sets divided by Total Demand Sourced. |
| Baseline Net Objective Unit Cost | Total Baseline cost (Baseline Misallocation + Baseline Distribution Cost) divided by Total Demand Sourced. When comparing scenarios, a lower Net Objective cost per Unit is better. |
| Rec # of Eaches Ratio to Baseline | # of simulated Eaches distributed with system recommended pack configurations / # of simulated Eaches distributed with baseline pack configurations. |
| Simulated # of Packs Allocated Ratio to Baseline | # of simulated Packs distributed with system recommended pack configurations / # of simulated Packs distributed with baseline pack configurations.. |
| Over Allocated Unit var Baseline % | % Units Over Allocated/% Units Over Allocated with Baseline Pack Configurations. |
| Under Allocated Unit var Baseline % | % Units Under Allocated/% Units Under Allocated with Baseline Pack Configurations. |
| Mis Allocated Unit var Baseline % | % Units Mis Allocated/% Units Mis Allocated with Baseline Pack Configurations. |
| Over Allocated Unit Cost / Baseline ratio | Over Allocated Cost per unit/Over Allocated Cost per Unit with Baseline Pack Configurations. |
| Under Allocated Unit Cost / Baseline ratio | Under Allocated Cost Per Unit / Under Allocated Cost per Unit with Baseline Pack Configurations. |
| Mis Allocated Unit Cost / Baseline ratio | Mis Allocated Cost Per Unit / Mis Allocated Cost per Unit with Baseline Pack Configurations. |
| Net Objective Unit Cost / Baseline ratio | Net Objective Cost Per Unit / Net Objective Cost per Unit with Baseline Pack Configurations. |
| Net Objective Cost | Total cost (Misallocation + Distribution Cost) minimized by the Optimizer, based on the system recommended pack configurations. |
| Baseline Net Objective Cost | Total cost (Misallocation + Distribution Cost) using the Baseline Pack Configurations. |
| Approved By | Approving user |
| Approved Date | Approved Date |
The user can quickly review the recommended pack configurations by clicking the status. A popup displays the details of the recommended pack configuration.
Users can select a scenario and approve or choose to drill down by clicking the Product. When they select the Product (clickable link), the bottom drawer opens with additional details to help aid the user in the approval process.
Figure 14-19 Approve Pack Configuration
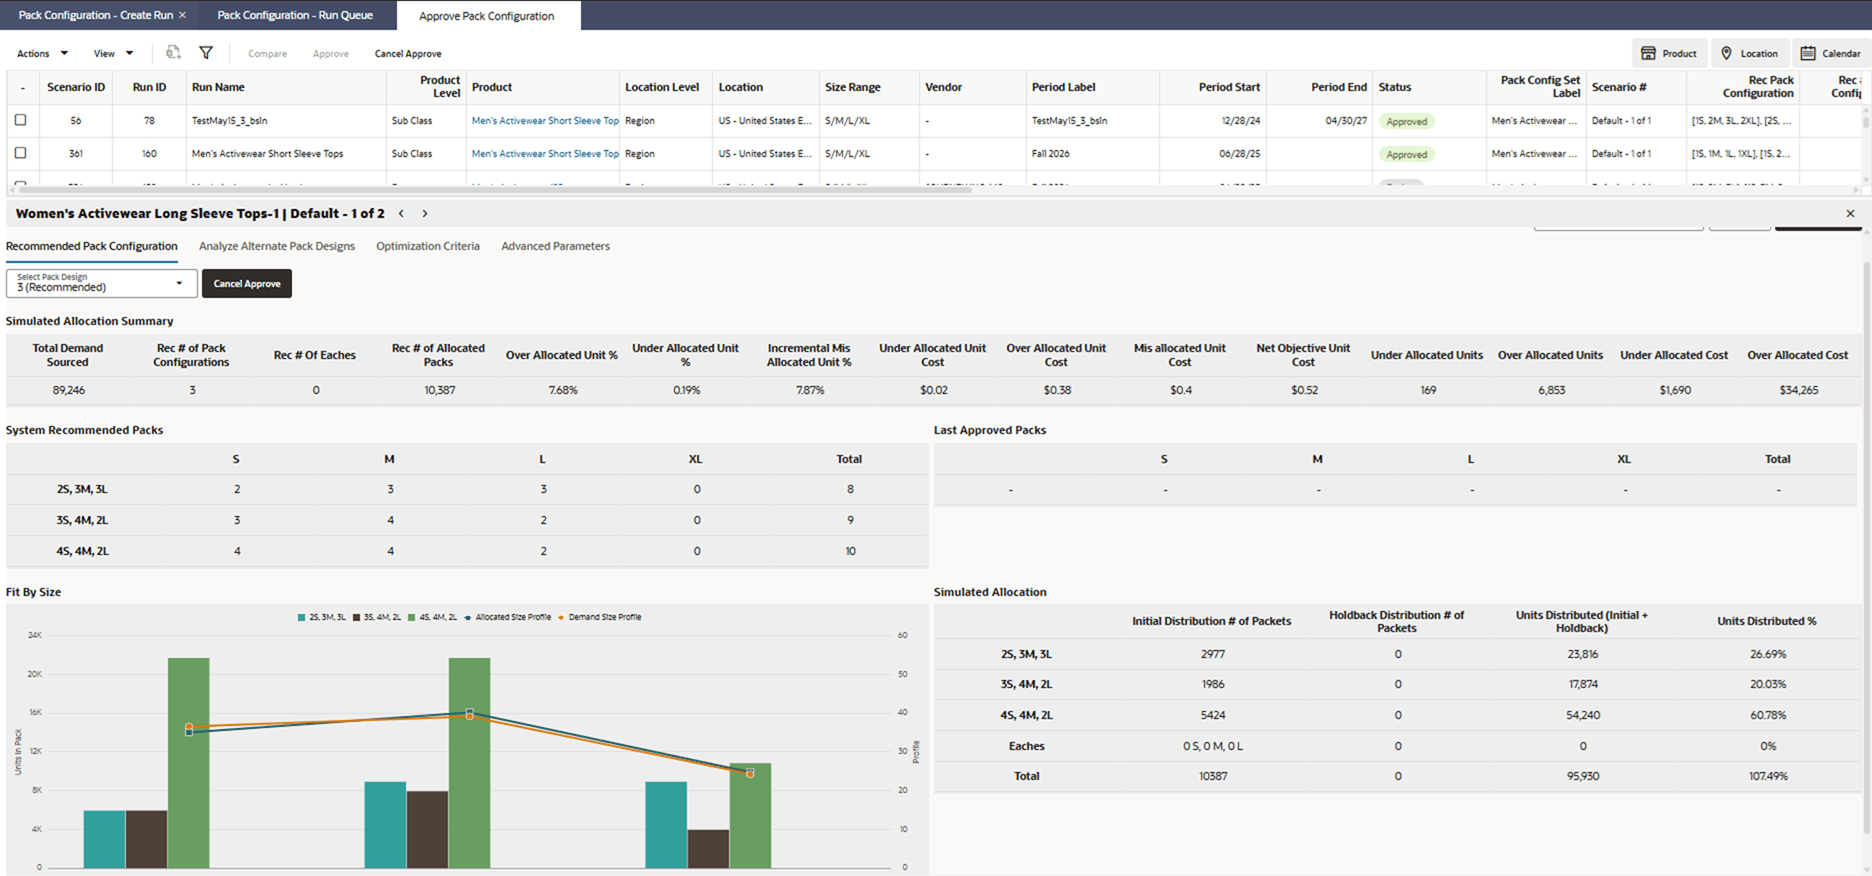
| Table | Column Label | Description | ||
|---|---|---|---|---|
| Simulated Allocation Summary | Units Under Allocated | Total Units Under Allocated as simulated by the system. The under allocated units are computed at the store level and aggregated up. | ||
| Units Over Allocated | Total Units Over Allocated as simulated by the system. The over allocated units are computed at the store level and aggregated up. | |||
| Under Allocation Cost | Under Allocation cost is computed as Units Under Allocated * over allocation cost factor. | |||
| Over Allocation Cost | Over Allocation cost is computed as Units Over Allocated * over allocation cost factor. | |||
| Fit By Size | Allocated Size Profile% | % of simulated allocated units across sizes | ||
| Demand Size Profile | % of demand across sizes | |||
| Simulated Allocation | Initial Distribution | # of Packets (Packs + Eaches) in Initial Distribution by Pack Configurations and Eaches | ||
| Holdback Distribution | # of Packets (Packs + Eaches) in Holdback Distribution by Pack Configurations and Eaches. This is zero if the specified holdback % is 0 for the scenario. | |||
| Total # of Units Distributed (Initial + Holdback) | Total # of Units Distributed (Initial + Holdback) by Pack Configurations and Eaches | |||
| % Distribution | % Distribution of allocated units by Pack configurations | |||
Analyze Alternate Pack Designs Tab
Users can click the Analyze Pack Designs tab to see alternate pack designs that were evaluated by the system before selecting the optimal pack design.
Figure 14-20 Analyze Alternate Pack Designs Tab
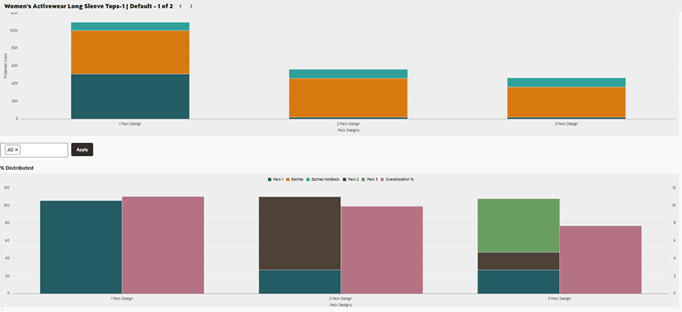
| Table | Column Label | Description |
|---|---|---|
| Total Objective Costs | Distribution Cost | Distribution cost is computed as # of Packets Distributed * pack distribution unit cost factor. |
| Eaches Distribution Cost | Eaches Distribution cost is computed as # of Eaches Distributed * eaches distribution unit cost factor. | |
| Holdback Distribution Cost | Holdback Eaches Distribution cost is computed as # of Eaches (or units) of Heldback demand * eaches distribution unit cost factor. | |
| % Distributed | Pack2 | % Distribution of Pack 1 |
| Eaches | % Distribution of Eaches | |
| Eaches Holdback | % Distribution of Eaches (or units) of heldback demand | |
| Pack 2 | % Distribution of Pack 2 | |
| Pack 3 | % Distribution of Pack 3 |
Optimization Criteria Tab
Figure 14-21 Optimization Criteria Tab
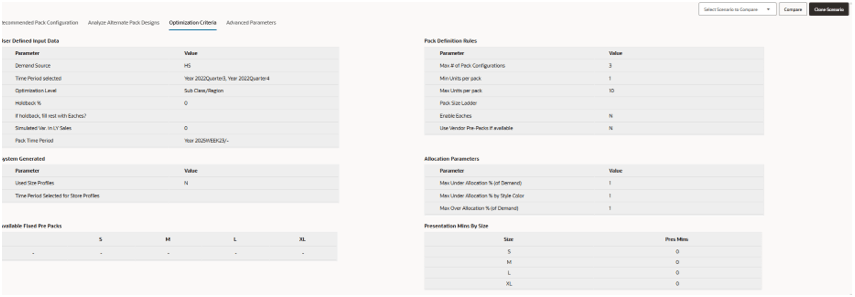
| Table | Metric Current Label | Description |
|---|---|---|
| User Defined Input Data | Demand Source | Source for Demand Data |
| Time Period Selected | Time period selected for demand data | |
| Optimization Level | Level at which optimal pack configurations are generated | |
| Holdback % | Non zero value indicates % of demand that is being simulated as heldback for future distribution in Eaches | |
| Pack Validity Time Period | Time Period for Pack Validity based on the Effective Periods defined during Create Run step for Optimizing Pack Configurations | |
| Pack Definition Rules | Max Number of Pack Configurations | Set as global default and overrideable, this is specified by user |
| Minimum total units per pack | Set as global default and overrideable, this is specified by user | |
| Maximum total units per pack | Set as global default and overrideable, this is specified by user | |
| Valid Pack Sizes Ladder | Set as global default and overrideable, this is specified by user | |
| Enable Eaches | Set as global default and overrideable, this is specified by user | |
| Use Vendor Pre-Packs if available | Set as global default and overrideable, this is specified by user | |
| System Generated | Used Size Profiles | Whether external size profiles were used |
| Allocation Parameters | Max Under Allocation % (of Demand) | Set as global default and overrideable, this is specified by user |
| Max Under Allocation % by Style | Set as global default and overrideable, this is specified by user | |
| Available Fixed Pre Packs | Available Fixed Pre Packs | Any user specified fixed pre packs |
| Presentation Minimums by Size | Pres. Mins | Any user specified Presentation Minimums. These are honored at the individual store specific levels |
Advanced Parameters Tab
Figure 14-22 Advanced Parameters Tab

| Column Label | Description |
|---|---|
| Under Allocation Unit Cost Factor | An input to the optimizer for the cost/penalty to be applied for every unit of demand under allocated at the sku/store level |
| Over Allocation Unit Cost Factor | An input to the optimizer for the cost/penalty to be applied for every unit of demand over allocated at the sku/store level |
| Distribution Unit Cost Factor | An input to the optimizer for the cost/penalty to be applied for every package distributed to meet demand. A package could be a pack or a single individual item (Eaches) |
User actions in the approval screen are to Approve or to Clone Scenario.
If the user chooses to Clone the scenario, in order to try addition scenarios before approval, they are first prompted to enter a scenario label. Following this, the user is taken to the Override screen in the Create Run flow with a newly cloned scenario.
Once the user approves a scenario, the scenario status gets updated as Approved. The Approval date and Approved by fields also get populated or updated. Any additional scenario statuses change to Overriden.