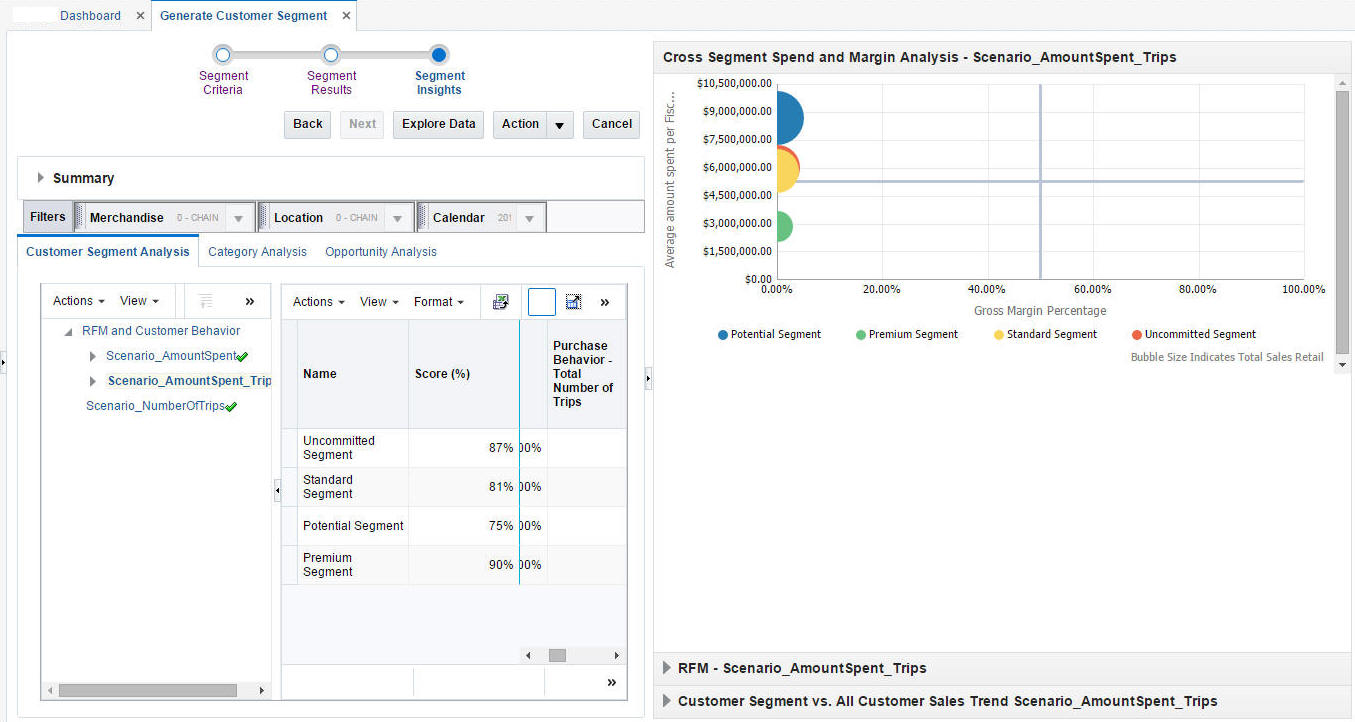
Cross Segment Spend and Margin Analysis BI
This BI compares how segments vary by Gross Margin% (x axis), Average Amount Spent <per configuration period> (y axis), and Total Sales Retail (z axis) for the customer segment. This can help you understand which segments are underperforming and have the potential for growth. The segments in the middle of the chart are the segments that have growth potential, as compared to the premium segments to the top right.
