Data Filtering Histograms
The following histograms illustrate the effects of filtering. You can use the information displayed in the histograms to adjust the configuration of the filters in order to eliminate outlier data. If you modify the filters, you must re-run the stage.
For information about adjusting the display of the histograms, see the Getting Started.
Table 3-10 Data Filtering Histograms
| Histogram Name | Description |
|---|---|
|
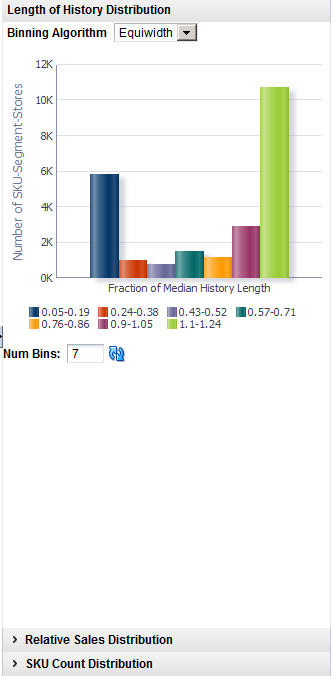
Length of History Distribution |
Displays the percentage of median history length relative to the number of SKU-segment-stores. |
|
Relative Sales Distribution |
Displays the percentage of median category sales relative to the number of SKU-segment-stores. |
|
SKU Count Distribution |
Displays the percentage of the median category SKU count relative to the number of segment-stores. |
Figure 3-9 DT Length of History Distribution Histogram

Description of "Figure 3-9 DT Length of History Distribution Histogram"