Data Filter Summary
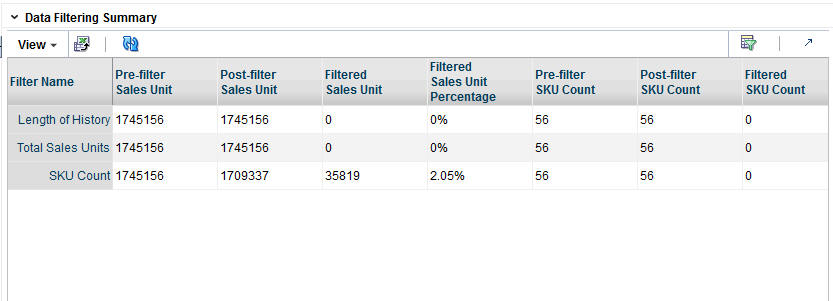
This section describes the Data Filter Summary, shown in Figure 3-8.
The following information is provided after the filtering is complete and quantifies the amount of data filtered out for baseline history, total sales units, sales amounts, and SKU counts. Use this information to assess the effects of filtering.
Click the Refresh icon to update the fields and see the latest information for this table.
Table 3-9 Data Filter Summary Fields
| Field Name | Field Description |
|---|---|
|
Filter Name |
The relevant filter of the three listed above. |
|
Pre-filter Sales Unit |
Amount prior to the application of the filter. |
|
Post-filter Sales Unit |
Amount remaining after the application of the filter. |
|
Filtered Sales Unit |
Amount filtered. |
|
Filtered Sales Unit Percentage |
Amount filtered, expressed as a percentage. |
|
Pre-filter SKU Count |
Amount prior to application of the filter. |
|
Post-filter SKU Count |
Amount remaining after application of the filter. |
|
Filtered SKU Count |
Amount filtered. |
|
Filtered SKU Count Percentage |
Amount filtered, expressed as a percentage. |
