Evaluation Histograms
The following histograms are displayed in the Evaluation stage. You can use the information from the histograms to understand the data that was pruned by the filters.
Table 2-17 Evaluation Histograms
| Name | Description |
|---|---|
|
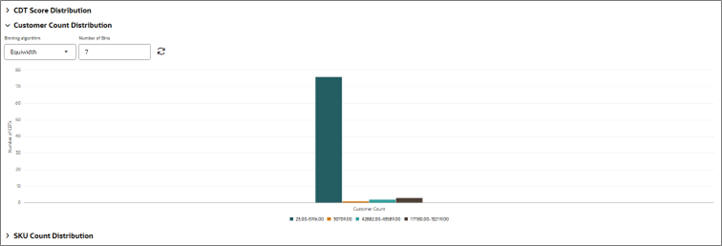
Customer Count Distribution |
Displays the number of CDTs for a specific customer count. |
|
SKU Count Distribution |
Displays the number of CDTs for a specific SKU count. |
|
CDT Score Distribution |
Displays the CDT score distribution. |
Figure 2-24 CDT Customer Count Distribution

Description of "Figure 2-24 CDT Customer Count Distribution"
When you have completed the evaluation of the results, click Next to go to the Escalation stage.