Pruning Results
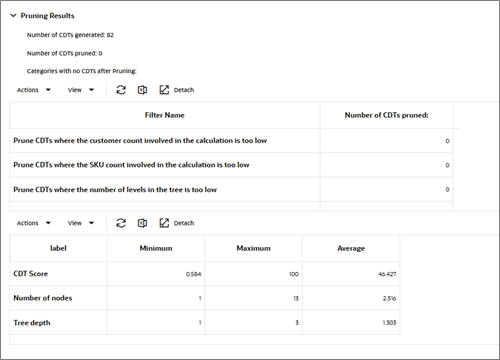
The Pruning Results are located below Pruning Setup and display information that can help you assess the effects of the values you provided for the pruning filters.
Table 2-16 Pruning Results
| Field Name | Field Description |
|---|---|
|
Number of CDTs Generated |
The number of CDTs that were generated by the Calculation stage. |
|
Number of CDTs Pruned |
The number of CDTs that were pruned after the filters were applied. |
|
Categories with no CDTs After Pruning |
The names of the categories from which all CDTs were pruned. |
Below this list is a table that identifies the number of CDTs that have been pruned by the following filters.
-
Prune CDTs where the customer count involved in the calculation is too low.
-
Prune CDTs where the SKU count involved in the calculation is too low.
-
Prune CDTs where the number of levels in the tree is too low.
-
Prune CDTs where the CDT score represents too low a quality.
A second table provides an overview of the pruning results, including the minimum, maximum, and average values for the CDT score, the number of nodes, and tree depth.
The number of nodes indicates the size of the tree. If a CDT contains few nodes, this can indicate a problem with the data or that too many nodes were excluded during the Calculation stage (because of a parameter setting).
Tree depth also indicates the size of the tree. This value can be used in conjunction with the Lowest Tree Level setting in the Calculation stage to analyze the results in terms of the number of levels in the tree.
