Features
The key features of Manage Notebook include:
-
Create, import, export, and clone python notebooks
-
Browse, filter, and search for Notebooks.
-
Add comments from the user interface (UI)
-
Visualize data in the form of a Graph Visualization.
-
Use collection of Python Libraries bundled with the product
-
Machine Learning packages such as (Tensorflow, Mxnet and Keras) Analyze
-
Optimization Solvers such as Gurobi
-
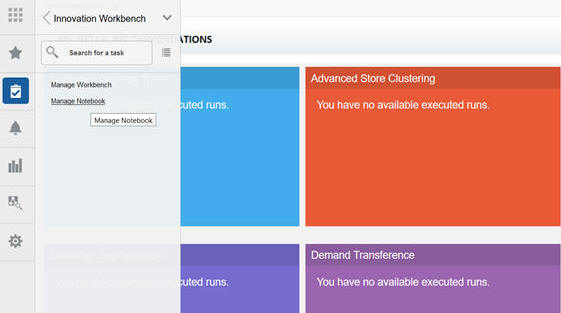
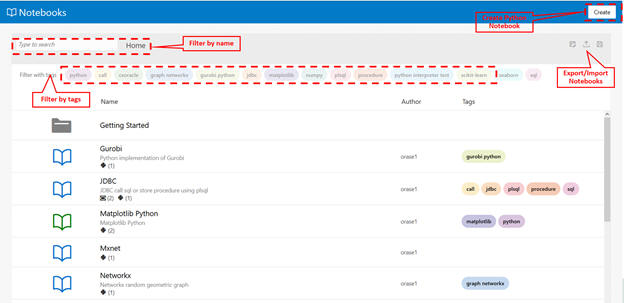
To access Python Notebook, click Innovation Workbench Manage Notebook. This opens a new tab in the browser and all the notebooks in the workspace are displayed.
From the workspace, you can import or export notebooks, create new workbooks, or copy notebooks. You can also browse, filter, and search for Notebooks using either a name or tags.
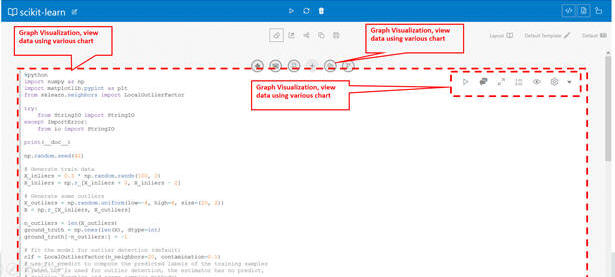
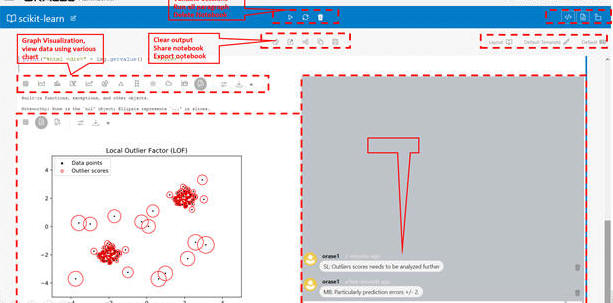
You can create a notebook and add paragraphs using the toolbar. These paragraphs can be Python, JDBC, Markdown, or graph analytics paragraphs. You can execute paragraphs individually and see the results at the bottom of each paragraph. You can also execute all the paragraphs from the toolbar provided at the top.
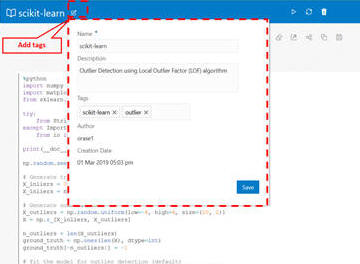
You can associate tags with the Notebook; these tags can be used for filtering and browsing the notebooks.
You can also add comments to the paragraphs and manage them from the user interface (UI). The comments can then be shared with others as a PDF. The Comments view shows all paragraph comments. You can visualize data in the form of a Graph Visualization and Exploration. You can explore graphs visually from within the notebook by viewing a summary of graphs or by using interactive exploration such as dragging, hovering, filtering, highlighting, and setting visualization properties. Different types of charts and graphs can be used for different types of datasets such as Line, Tag-Cloud, Tree Map, Scatter Plot, and so on.
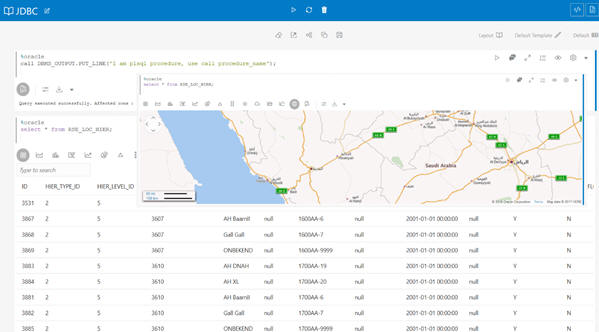
You can visualize data in the form of a map and configure a column from a dataset to represent the latitude, longitude, title, and description.
