Recent Run Reports
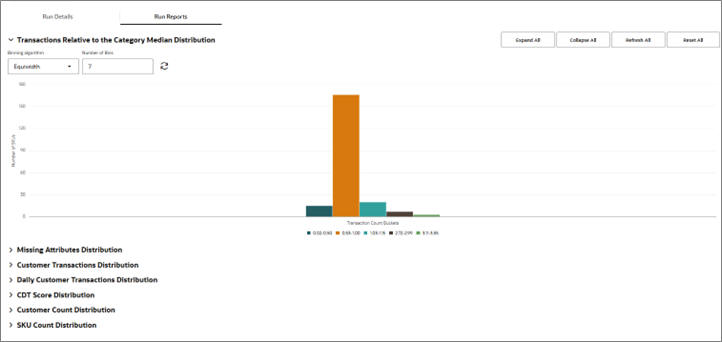
The Recent Run Reports displays, for the current execution and the current user, the different histograms created by the CDT generation process.
Figure 2-4 Recent Run Reports

Below is a list of all histograms included in these reports.
| Field Name | Generation Stage Effect | Description |
|---|---|---|
| Transactions Relative to the Category Median Distribution | Data Filtering | Displays the number of transactions relative to the category median for a SKU's category. |
| Missing Attributes Distribution | Data Filtering | Displays the number of attributes that have missing values per number of SKUs |
| Customer Transactions Distribution | Data Filtering | Displays the number of transactions in historical data per number of customers. |
| Daily Customer Transactions Distribution | Data Filtering | Displays the relative number of transactions per day per number of customers. |
| CDT Score Distribution | Calculation | Displays the range of CDT scores and their frequencies for the current run. |
| Customer Count Distribution | Escalation | Displays the number of CDTs for a specific customer count. |
| SKU Count Distribution | Escalation | Displays the number of CDTs for a specific SKU count. |
For detailed information about using the histograms, see the corresponding Generation Stage or Getting Started.