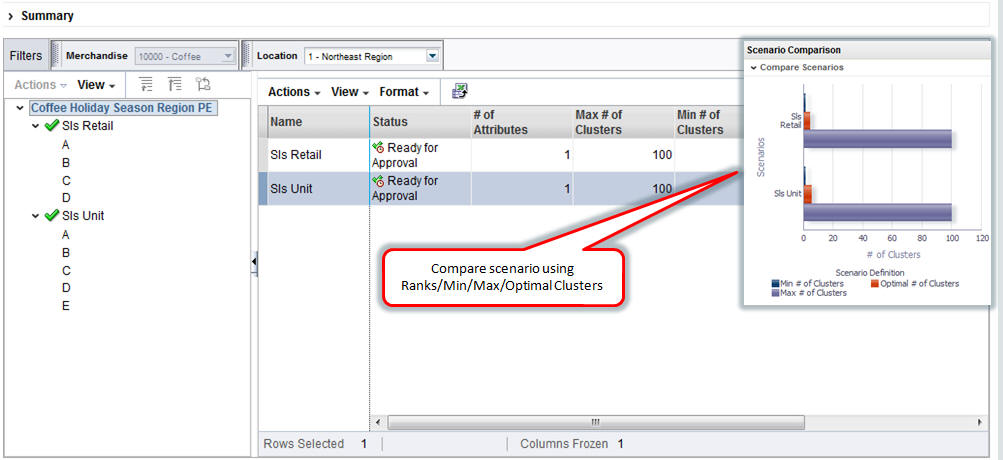
Scenario Compare
Multiple scenarios are compared using optimality and scenario rank. This chart is displayed when multiple scenarios for the criteria are available. The following properties are used by the chart: minimum number of clusters, maximum number of clusters, optimal number of clusters, and the rank of the scenarios, from top to bottom.
