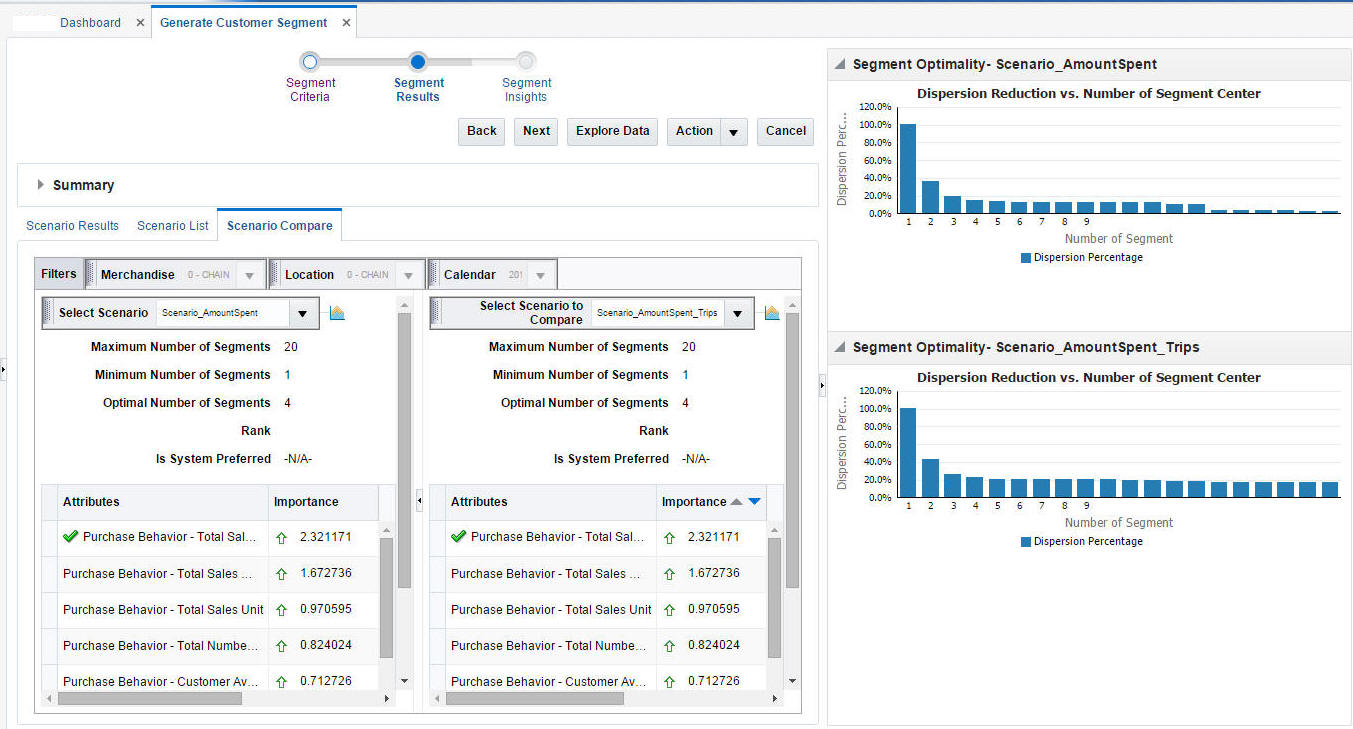
Scenario Optimality
This graph indicates how the system identifies the best number of segments for a given data set. It starts with a small number of segment centers and searches for the number beyond which there is minimal dispersion. At this point, increasing the number of segment centers any more only reduces dispersion by a small amount, and the marginal improvement is small.
