Scenario Results Section
The Scenario Results section displays the following:
-
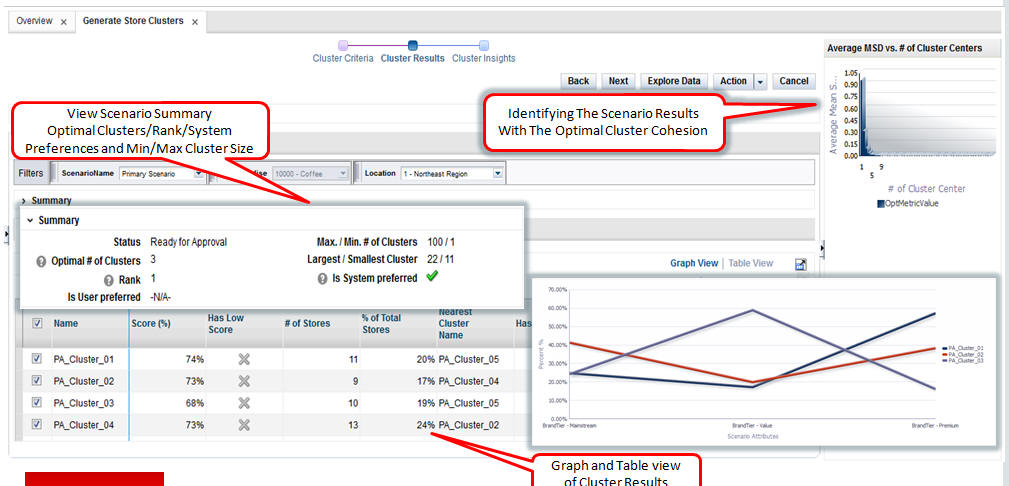
The Scenario Summary, which provides key cluster set attributes for the executed scenario as well as its status.
-
The Scenario Results, which has three tabs: Clusters, Cluster Composition, and Cluster Hierarchy.
The Summary section provides an overview of the characteristics of the clusters.
Table 4-18 Scenario Results Summary
| Field | Description |
|---|---|
|
Status |
Created, Ready for Approval, Completed with Errors, Approved, Rejected. |
|
Optimal # of Clusters |
The optimal number of clusters determined by the optimization. |
|
Rank |
The application compares executed scenarios and ranks them. A value of 1 indicates the best scenario. |
|
Max./Min # of Clusters |
The number you provided for the maximum and minimum number of clusters to calculated. |
|
Largest/Smallest Cluster |
Provides the sizes of the largest cluster and the smallest cluster in order to show the range of values. |
|
Is System Preferred |
Indicates whether or not the system prefers the scenario. |
|
Is User Preferred |
Indicates whether or not the user prefers the scenario. |
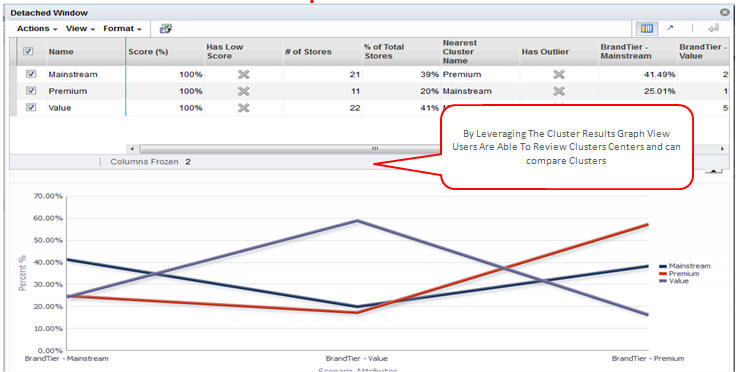
The Clusters section provides the cluster results for each individual cluster in the scenario in either a Graph View or a Table View. The attributes displayed depend on the Cluster by option chosen in the Cluster Criteria stage.
The Graph View shows the percentage for each attribute in the cluster.
The Table View provides details that can help you analyze the cluster.
Table 4-19 Scenario Results - Clusters: Table View
| Field | Description |
|---|---|
|
Name |
The name you assigned to the cluster. |
|
# of Stores |
The number of stores in the cluster. |
|
% of Total Stores |
The percentage of the total stores that the number of stores represents. |
|
Nearest Cluster Name |
The name of the cluster that is most similar to this cluster. |
|
Score % |
This value is calculated at the level of store and then averaged to the cluster. The probability, expressed as a percentage, of a store being present in this cluster rather than any of the other clusters. |
|
Has Outlier |
Indicates a cluster with the number of stores below a threshold. For example, the number of stores are below certain percentage of the number of stores in a cluster. |
|
Has Low Score |
The score threshold can be defined in two ways. The default threshold is calculated as a probability that a store exists in any one of the clusters. The user can further override this threshold at the time of deployment by each Cluster by. |
|
Attributes and their % |
For each attribute specific to the Cluster by option, the value indicates the percentage that attribute represents within the total cluster. |
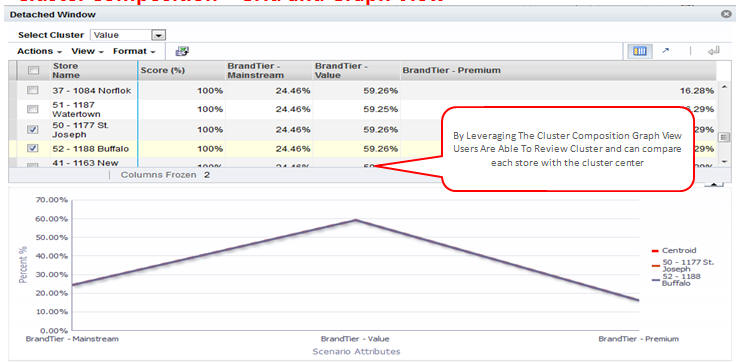
The Clusters Composition sub-tab breaks down the cluster into its component parts and shows the percentages for each attribute.
The Table View, shown in Figure 4-24, shows attributes and the score percent.
Figure 4-24 Cluster Composition Table View

Description of "Figure 4-24 Cluster Composition Table View"
The Graph View shows the centroid of a cluster and allows the user to compare each store with the cluster centroid.

