Test
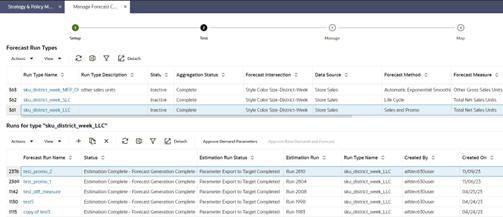
In the Test screen, the top table shows all the run types that have complete aggregation. This table shows the same information as the run type table in the Setup screen. The bottom table shows all the what-if runs and batch runs associated with the selected run type in the top table. In addition to Forecast Run Name, Created On, Created By, and Completed On, the table shows the following information about the run.
Status
The Status column in the run overview table shows the progress of the run by showing the status of the different stages of estimation and forecasting.
-
Setup
-
Preprocessing in Progress, Preprocessing Failed
-
Preprocessing Complete - Estimation in Progress, Preprocessing Complete - Estimation Failed
-
Estimation Complete - Base Demand in Progress, Estimation Complete - Base Demand Failed, Estimation Complete - Base Demand Complete, Estimation Complete - Base Demand Complete with Zero Rows
-
Estimation Complete - Forecast Generation in Progress, Estimation Complete - Forecast Generation Failed, Estimation Complete - Forecast Generation Complete, Estimation Complete - Forecast Generation Complete with Zero Rows
Estimation Run
In all forecast methods, the estimation process runs initially to generate the demand parameters such as seasonality and elasticity. Subsequently, the forecast process runs to generate the base demand and the forecast using the outputs from the estimation process. The Estimation Run column shows the name of the estimation run that is behind the forecast run:
Run Type Name
Each run is associated with a run type. This column shows the name of the run type.
Estimation Results
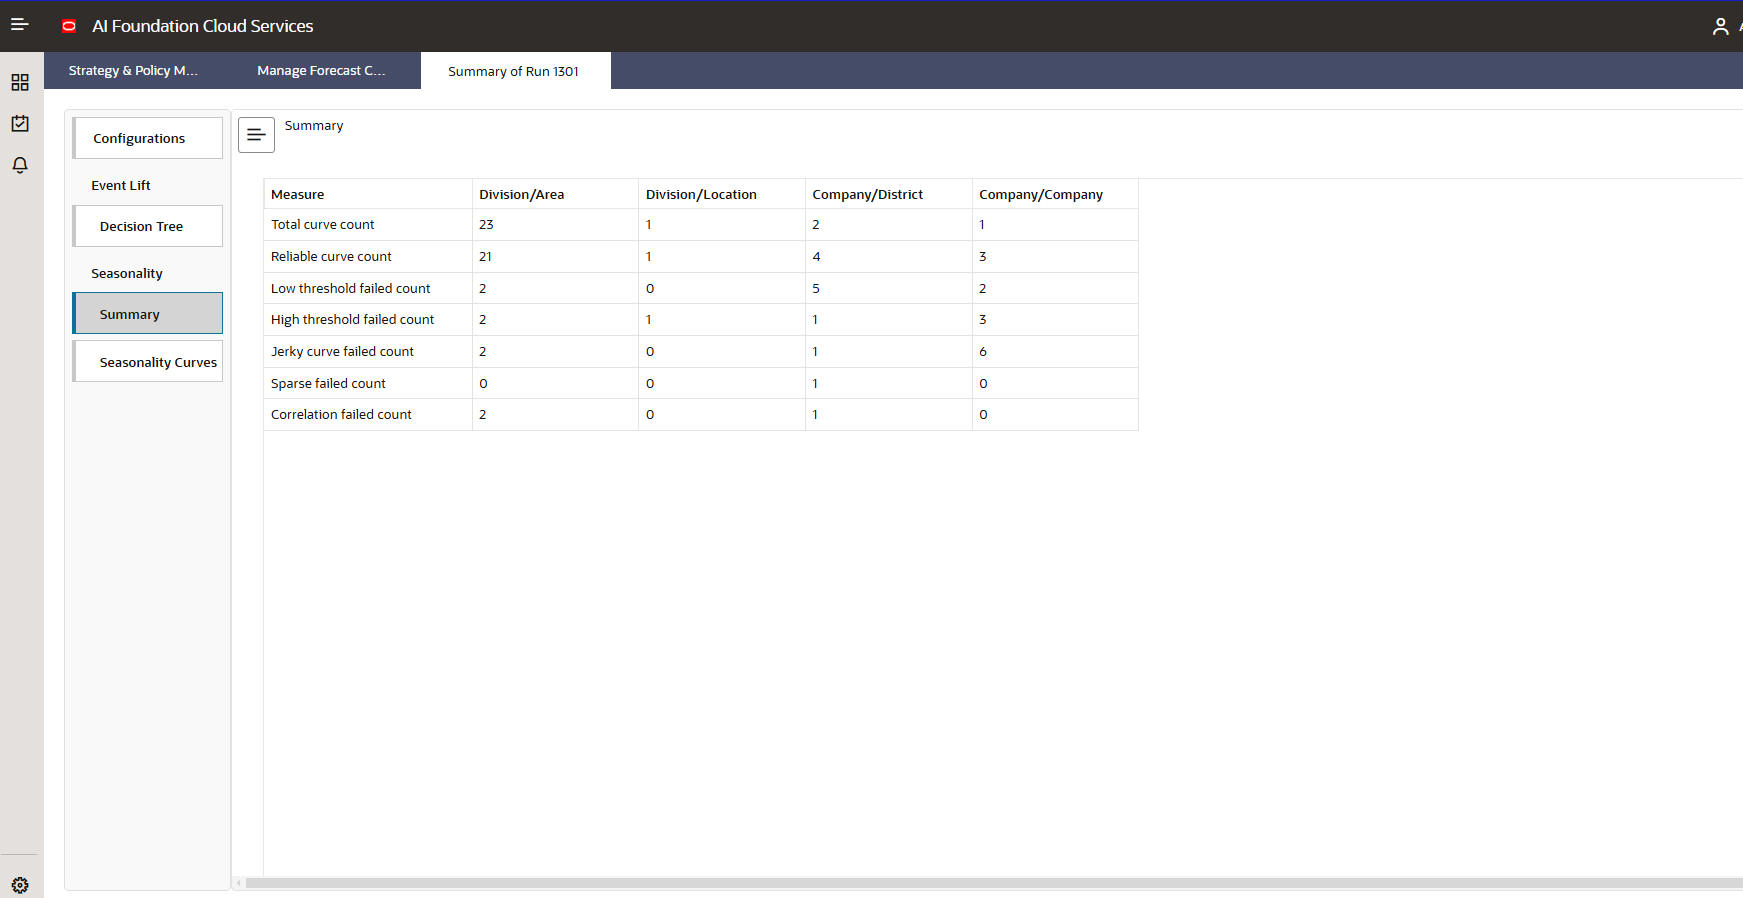
This column shows the link to different output screens. The Summary link opens a tab that provides information about the different stages of demand parameter estimation. This link is enabled for all runs for which the estimation process has completed successfully.
Summary
Figure 11-18 Summary
-
Total Curve Count: This measure shows the total number of calculated seasonality curves.
-
Reliable Curve Count: This measure shows the number of seasonality curves that passed the pruning stage.
-
Low Threshold Failed Count: This measure shows the number of seasonality curves that did not pass the check for low seasonality indices.
-
High Threshold Failed Count: This measure shows the number of seasonality curves that did not pass the check for large seasonality indices.
-
Jerky Curve Failed Count: This measure shows the number of seasonality curves that did not pass the check for jerky curves.
-
Sparse Failed Count: This measure shows the number of seasonality curves that did not pass the check for sparse curves.
-
Correlation Failed Count: This measure shows the number of seasonality curves that did not correlate well with demand.
Seasonality
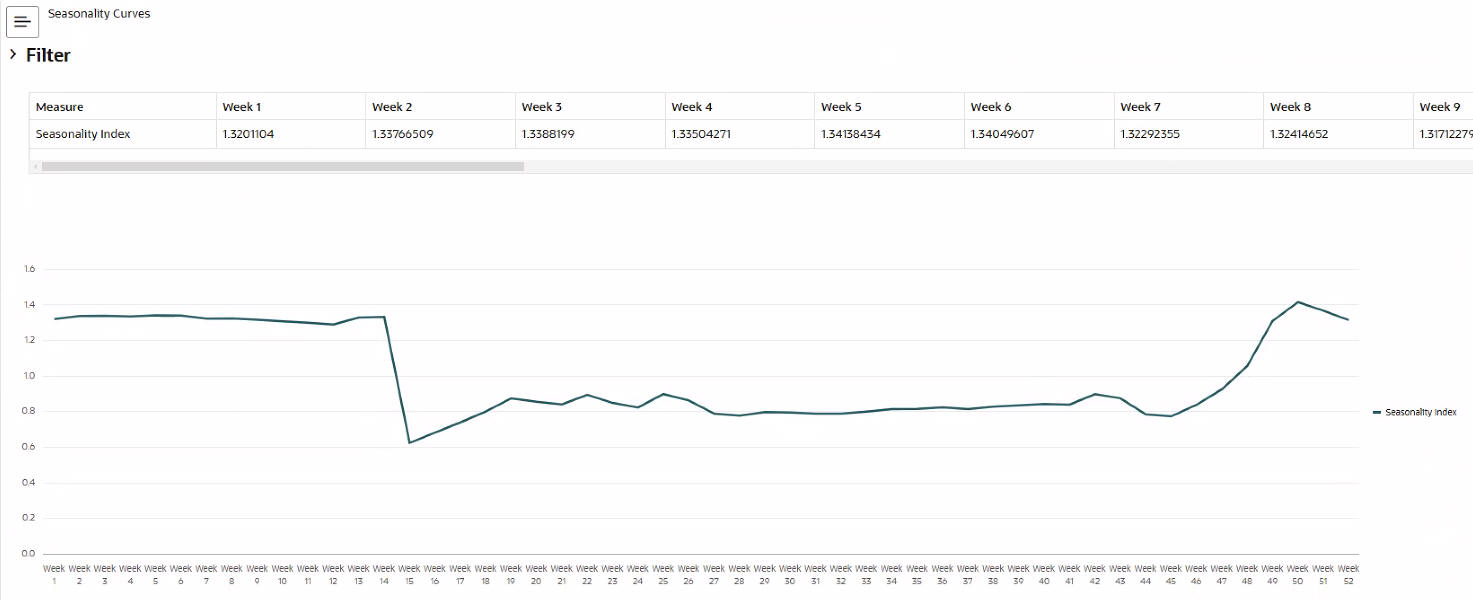
Here you can review the seasonality curves at several escalation levels. For each curve the table contains values of the seasonal indexes. Below is the visual representation of the indexes. The sum of the index values adds up to 52. Using the Filter settings you can navigate to product location combinations for the available escalation levels.
Figure 11-19 Seasonality
Preprocessing
-
Out of stock situations where an item would have likely sold more
-
Outliers like fatty fingers or Software bugs
-
Promotions that can boost sales
-
Weather that can boost or lower sales. Examples include hurricanes for water bottles, or rain for barbecue items
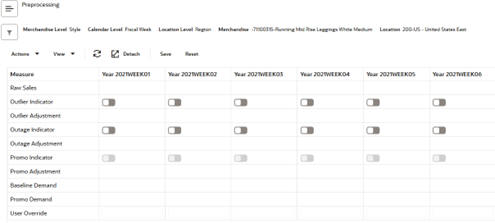
Figure 11-20 Preprocessing
| Measure | Description |
|---|---|
| Depromote Adjustment | This measure displays the units that were removed from the historical sales, because they were caused by the lift in demand due to one or more offers. |
| Outage Adjustment | This measure displays the units that were added to the historical sales, because they were caused by the artificial drop in demand due to stockouts. |
| Outlier Adjustment | This measure displays the units that were added to the historical sales, because they were caused by the artificial drop in demand due unusual events, like human error, or extreme bottle water sales during a hurricane. |
| Outage Indicator | This measure is either loaded or calculated by the rules in the custom menu. It is used during the pre-processing run that corrects sales for lost sales. |
| Promotion Indicator |
This measure is usually calculated as the or of all available offers that are active for a Product/Location/calendar combination. It is used during the preprocessing run that removes promotional sales. |
| Baseline Demand |
This measure represents the demand that was sold at a location without the influence of any outside factor. |
| Historical Discount | This measure displays the units that were removed from the historical sales, because they were caused by the lift in demand due to one or more offers. When the Historical Discount or Historical Event measures are not blank, it is likely that the Promotion Indicator is On, and the Depromote Adjustment will also have a non-zero value. |
| Historical Event | When the Historical Discount or Historical Event measures are not blank, it is likely that the Promotion Indicator is On, and the Depromote Adjustment will also have a non-zero value. |
| Outlier Indicator | This measure is either loaded or calculated by the rules in the custom menu. It is used during the pre-processing run that corrects the sales for outliers. |
| Raw Sales |
This measure is loaded and it represents the historical sales at a Product/Location/calendar period level. It is different from demand because it may be constrained by stockouts, outliers, weather, and so on. |
| Promo Demand | This measure represents the demand – including promotion and offer data that was sold at a Product/Location/calendar. If configured properly, the stockout and outliers impact is removed. |
| User Override | After reviewing all the above measures, this is the place to override the demand at the Product/Location/calendar level. This can be useful for special cases (introduction of key items) as well as extreme situations when entire departments were hurt by natural events, like a pandemic. |
Decision Tree
Here you can review a summary of the promotion rules, as well the graph of the decision tree created according to the rules.
Figure 11-21 Decision Tree

Promotion Lift
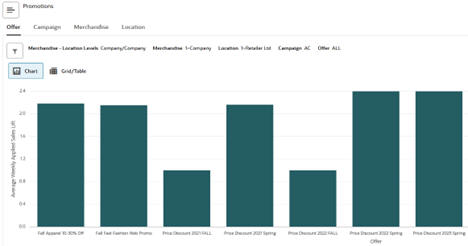
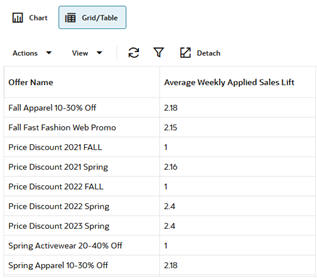
Here you can review the Average Weekly Applied Sales Lift at different levels in the location and product hierarchies. The information can further be sliced and diced by campaign and its encompassing offers. You can review in a chart or table format.
Figure 11-22 Promotion Lift
For different forecast methods, the summary will display different statistics. For instance, for the Options Forecast the summary displays information around the Life Cycle method, the Optimize History step, as well as the Attribute Weights results, the Incrementality Curve and Sales Potential steps.
Figure 11-23 Promotion Lift Chart

For different forecast methods the summary will display different statistics. For instance, for the Options Forecast, the summary displays information around the Life Cycle method, the Optimize History step, as well as Attribute Weights results, the Incrementality Curve, and Sales Potential steps.
