Retail Home
If Retail Home is configured, it provides a dashboard view of key configured metrics as tiles across multiple applications in the enterprise. MFPCS has the following tile views configured for Retail Home. The metrics are configured in the same dashboard templates, so the regular dashboard segment first should be built first, in order to see the tiles from Retail Home. Retail Home uses a different set of JSON files to get the data from the dashboard segments into these tiles. For template versions, after the domain is configured, the customer needs to seed the retail home JSON file once after Retail Home is configured. For more details about how to seed Retail Home JSON files, see the Oracle Retail Predictive Application Server Cloud Edition Administration Guide.
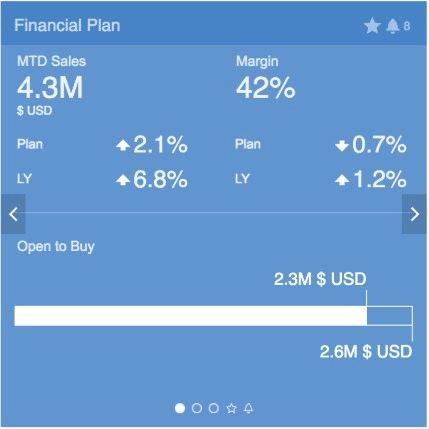
Figure 1-12 MFPCS Tile View for Retail Home

Metrics shown in the above figure:
-
Month-to-Date Sales (MTD)
-
MTD Sales to Plan (OP)
-
MTD Sales variance to LY
-
MTD Margin %
-
MTD Margin variance to Plan (OP)
-
MTD Margin variance to LY
-
Open to Buy bullet chart: total is Open to Buy + Net On Order
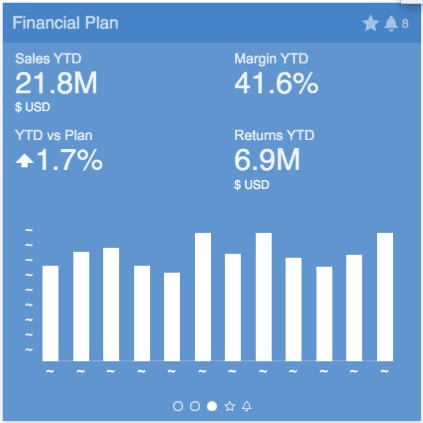
Figure 1-13 MFPCS Tile View for Retail Home

Metrics shown in the above figure:
-
Year-to-Date Sales (YTD)
-
YTD Margin %
-
YTD Sales variance to Plan (OP)
-
YTD Returns
-
Line Chart: YTD Sales variance to Plan with X-axis as Month