Scheduling Configured Batch Administration Tasks
This section walks through an example of the process for scheduling and monitoring the Configured Batch Administration task named Run Batch Measure Export Group. The steps for scheduling all other tasks are similar, and most of the tasks do not have additional input parameters specific to that task. For more details about scheduling and monitoring Online Administration Tool tasks, see the Oracle Retail Predictive Application Server Cloud Edition Administration Guide.
To schedule and monitor a Configured Batch Administration task:
-
Log in to the APCS application as an Administration user.
-
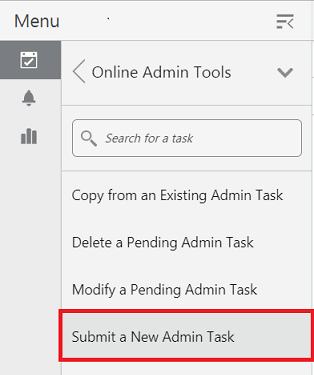
In the Tasks list, select Admin Tasks for AP CS Customer Domain and then select Online Admin Tools. Click Submit a New Admin Task.
Figure 1-1 Administration Tasks
-
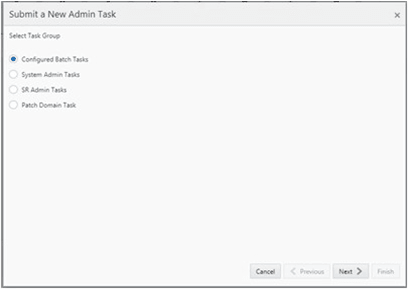
Select the Configured Batch Tasks for the Task Group and click Next.
Figure 1-2 Select Task Group Window
-
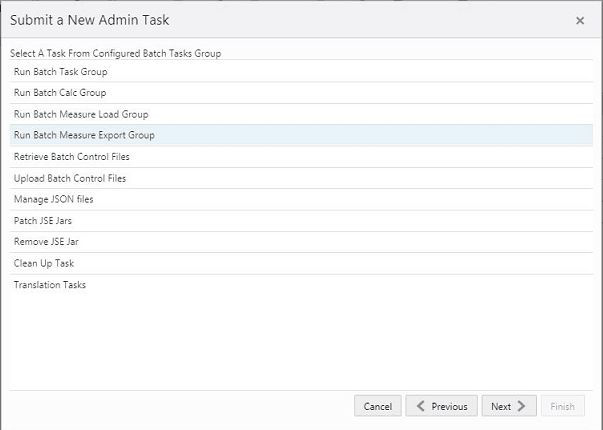
In the task list, select Run Measure Export Group and click Next.
Figure 1-3 Select Task Workbook Wizard Window
-
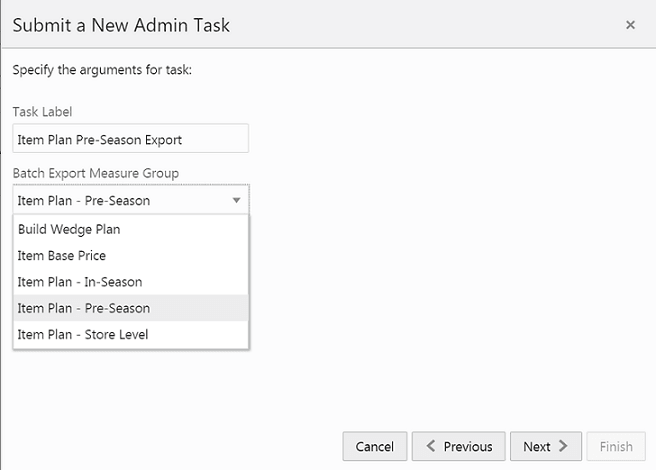
Enter the Task Label. This task has an additional parameter to choose the export measure group. In following figure, as an example, Item Plan - Pre-Season is selected. Click Next.
Figure 1-4 Select Export Measure Group
-
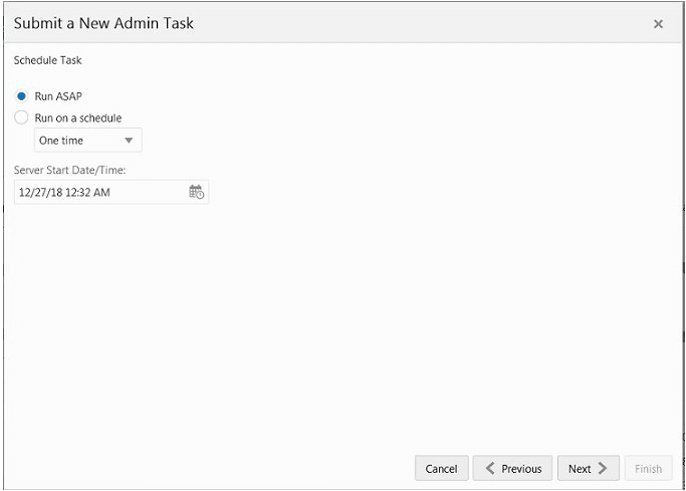
To schedule the task to run immediately, select Run ASAP and click Next. To run on a particular date and time, select Run on a Schedule (One time / Hourly /Daily/ Weekly/ Monthly). Provide the Server Start / Stop Date/Time and click Next.
Figure 1-5 Schedule Task Workbook Wizard Window
-
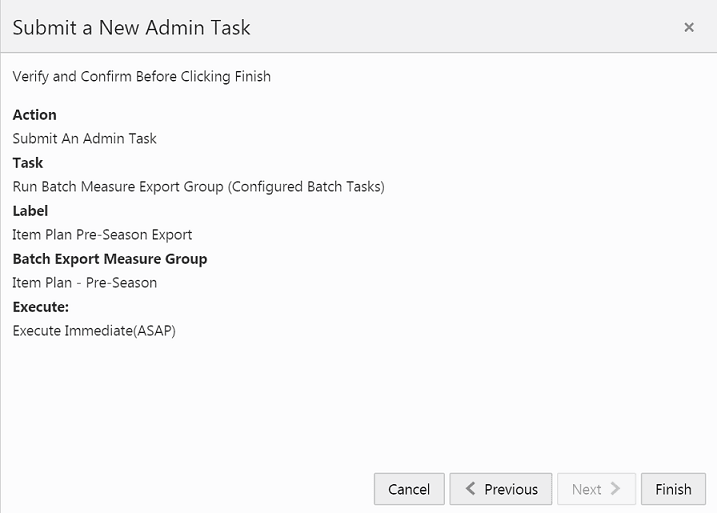
In the Confirm Action window, review the task scheduling details. To confirm the scheduling and submit the task, click Finish.
Figure 1-6 Confirm Action Window
The task submitted confirmation message appears.
Figure 1-7 Task Submitted Confirmation Message

-
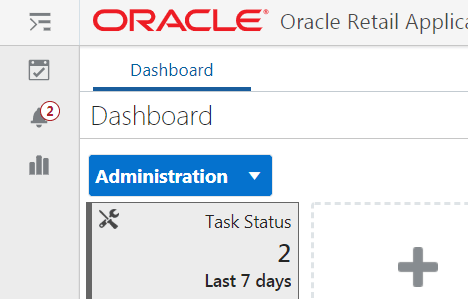
To check the status of all submitted tasks in the Dashboard, click Dashboard and select Administration from the list of Dashboard Profiles in the dropdown.
Figure 1-8 Location of Administration Dashboard Selection
At the bottom of the dashboard, it contains the lists of tasks submitted and their status.
Figure 1-9 List of Submitted Tasks
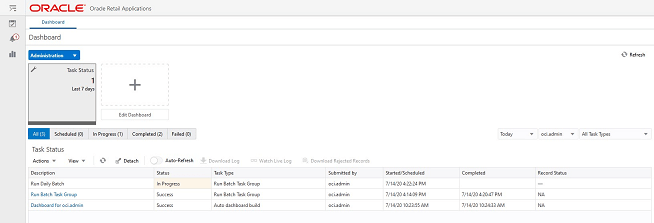
The Status column shows whether a job has completed successfully, failed, or is pending (Scheduled). For any completed (Success/Failed) tasks, click the job name to view the subtask details if any for that job. To view the log, select the task and click Download Log. For failed tasks, the logs show the error details.
Following is an example of a log showing an error:

Following is an example of a log showing the cause of an error:

Note:
The detailed log file will also be uploaded to Object Storage so the customer can download. The log file names are first appended with planning/outgoing/logs/ and with the text success/failure (with error code) along with the process name and control file entry set names and the time stamp for easy identification. For example:
/planning/outgoing/logs/success.eebatch_calc.exp_set.20190614124917.tar.gz
/planning/outgoing/logs/failure.13.eebatch_exec.setup.20190614043009.tar.gz