7 KPI Dashboards
This chapter describes the facilities for creating Key Performance Indicator (KPI) reports. These may be simple reports or presented as a dashboard on the Home page.
KPIs differ from reports in that they report on a single value that is measured at a point in time. A dashboard can present the result as a simple table or as a chart. An example of a KPI could be a weekly count of the number of active products or supplier sites, or the number of audits due to be completed in the next 30 days.
A KPI is based on a KPI Report Template, which are configured to specify a single column from a data source and the aggregate function to calculate the required measure. KPI templates can be configured by users with the Advanced Reporting Administrator authority profile. For details on the administration of KPI templates, see KPI Report Templates.
The following aggregate functions are available:
-
Minimum - the minimum in a range of values
-
Maximum - the maximum in a range of values
-
Sum - the sum of a set of values
-
Average - the average of a set of values
-
Count - the number of occurrences in a set of values
-
Distinct - the number of unique occurrences in a set of values
Once a KPI template has been created it is scheduled to run in the same way as a report (see Scheduling Reports), at which point the actual value is calculated and saved in the KPI Results area of the Report Outputs (see Viewing Reports).
KPI Dashboards can be created, edited, and deleted by users with the Advanced Reporting Administrator authority profile. The KPI dashboards can then be selected to display on the home page of users with the Advanced Reporting User and Advanced Reporting Reader authority profile if the user is a recipient of the KPI (and subject to any EAC Area restrictions).
For information on building KPI reports, see Appendix: Designing RTF Templates.
Creating a KPI Dashboard
To create a new KPI dashboard:
-
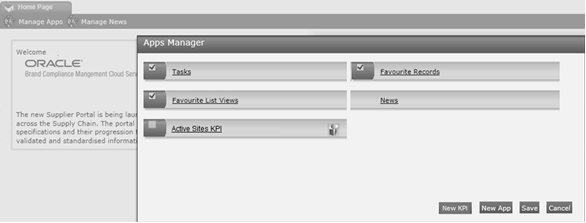
On the Home page, click Manage Apps. The Apps Manager dialog box appears.
Figure 7-1 Apps Manager Dialog Box

-
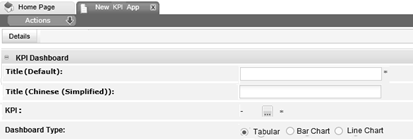
Click New KPI. The New KPI Dashboard page appears.
Figure 7-2 New KPI Dashboard Page

-
Enter the details.
Table 7-1 New KPI Dashboard Page
Details Description Title
Enter the description for this KPI dashboard in the supported languages. The description for the default language is mandatory.
KPI
Select the KPI from the list of KPI Report Schedules you have access to. Mandatory field.
Dashboard Type
Select to show the KPI as either Tabular, a Bar Chart, or a Line Chart. The default option is Tabular.
-
Save the changes and exit.
-
Click Manage Apps again. The KPI now appears in the list of apps.
-
Check the KPI and click Save. The KPI appears as an app on the Home page.
Figure 7-3 KPI Home Page Dashboard App

The app can be moved within the Home page by clicking and holding its title bar, then dragging and dropping at the desired location.
Editing a KPI Dashboard
To edit a KPI dashboard:
-
On the Home page, click Manage Apps. The Apps Manager dialog box appears.
-
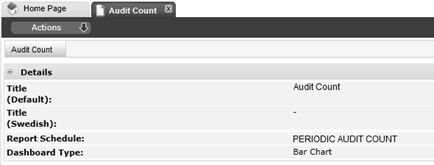
Click the KPI dashboard title. The KPI Dashboard page appears.
Figure 7-4 KPI Dashboard Page

-
Select the Edit action and enter the details.
-
Save the changes and exit.
-
Check the KPI in the Apps Manager dialog box and click Save to close the Manage Apps dialog box and return to the Home page.
Deleting a KPI Dashboard
To delete a KPI dashboard:
-
On the Home page, click Manage Apps. The Apps Manager dialog box appears.
-
Click the Delete
 icon next to the KPI dashboard title. A delete confirmation prompt appears.
-
To continue with the deletion, click Ok. To return to the Apps Manager dialog box, click Cancel.
-
Click Save to close the Manage Apps dialog box and return to the Home page.
Example: Audits Due in 30 Days KPI
This example creates a simple KPI dashboard to show the number of Audits due in the next 30 days.
-
Create a new Data Source (if a suitable data source does not already exist).
Code:
AUDITS_DUE_KPI
Description:
Audits Due KPI
Data Source Type:
Query
Selected Columns:
Code; Status; Due Date
Save and activate the data source.
-
Create the KPI Template to count the distinct number of Audits where the due date is less than 30 days, relative to the date the report is run.
Code:
AUDITS_DUE_30
Description:
Audits Due in 30 Days
Query:
AUDITS_DUE_KPI (Audits Due KPI)
Selected Column:
Code
Aggregate Function:
Distinct
Filter:
Column:
Due Date
Operator:
Less Than
Type:
Relative
Runtime Value:
No
Ignore Case:
Yes
Value:
30
Unit:
Day
Save and activate the template.
-
Create the Report Schedule to calculate the KPI.
Code:
AUDITS_DUE_30_KPI
Description:
Audits Due in the next 30 Days
Report Type:
KPI
KPI Report:
AUDITS_DUE_30 (Audits Due in 30 Days)
Set suitable scheduling options, then save and activate the schedule.
-
View the KPI Report Output.
Locate the entry in the Report Outputs, within the KPI Results folder, where the schedule description is Audits Due in the next 30 Days. The list view will show the date and time of calculation and the calculated value.
-
Add the KPI Dashboard to the Home page.
Click Manage Apps and select the Audits Due in the next 30 Days KPI.
Title:
KPI: Audits Due in the next 30 Days
Report Schedule:
Audits Due in the next 30 Days
Dashboard Type:
Tabular
Save and activate the KPI dashboard.
Click Save to close the Manage Apps dialog box. The KPI app appears on the Home page.