3 Report Administration
This chapter covers the report administration features of the Reports module. The following topics are covered:
Data Sources
Data Sources provide access to the Brand Compliance data for reporting purposes. The reportable Brand Compliance data is made available through a set of predefined SQL queries and APIs which give access to the majority of the application's data. Related data is grouped and joined in a way that is optimized for efficient reporting. A data source may be used in any number of report templates.
Note:
The supplied core data sources cannot be edited, deactivated, or deleted.
While the contents of the supplied data source queries (that is, the records and the fields therein) are not configurable, the Data Source records that contain them can be copied and adapted to form custom variants by creating subsets of the reportable fields and applying filters to the data.
Filters are used to refine the data source contents to a data set appropriate for a particular type of report. Costs and weightings are applied to the data source to help limit reports to a manageable size. A data warehouse is used to source the data for high volume reports, thus reducing the impact on the Brand Compliance application.
To access the Data Sources, select the Manage Reporting Data Sources option in the Reporting Admin area. This is only accessible to users with the Advanced Reporting Administrator authority profile.
The list of data sources is displayed, grouped by status. A single Default list view is provided. For each data source, the description, code, query name, and version are shown. A column indicates if the data source is one of the system-delivered core sets.
Figure 3-1 Data Sources Page

To see the details for a specific data source, double-click the row. A tab opens with the details. You can also select the View or Edit actions.
Note:
The Data Source records can be imported and exported using the Import and Export list view actions, however rows in the Filters table that relate to glossary selections or enumerations are excluded.
If using the Import action to create a new data source, the system-delivered flag must be set to No, else the imported data source will not be editable.
Creating a Data Source
To create a new data source:
-
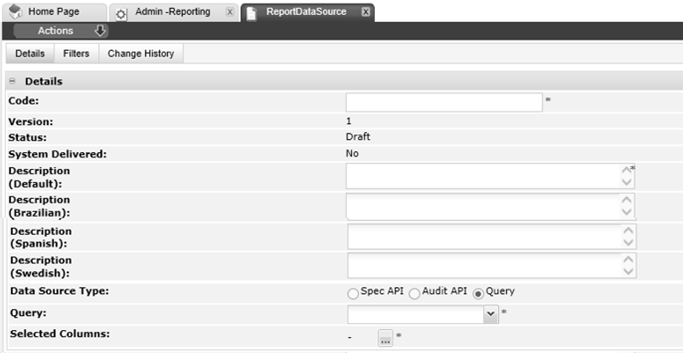
Select the New action. The New Report Data Source page appears.
Figure 3-2 New Report Data Source Page
-
Enter the details.
Table 3-1 New Report Data Source Page
Details Description Code
Enter a unique uppercase code for this data source. Mandatory field.
Version
The version will default to 1. Read-only field.
Status
This will default to Draft. Read-only field.
System Delivered
This will default to No. Read-only field.
Description
Enter the description for this data source in the supported languages. The description for the default language is mandatory.
Data Source Type
Select the type of data source. The default option is Query, which is the usual option for a tabular report. The Spec API and Audit API options are used for form reports that present a page per Product Specification or Audit/Visit.
Query
Select the query that corresponds to the data to be provided by the data source. Mandatory field. This field is hidden if one of the APIs has been selected as the data source type. The options in the list are fixed, based on the set of predefined queries provided by Oracle.
Selected Columns
Once the query has been selected, click the icon to select which of its columns are to be provided by the data source. This field is hidden if one of the APIs has been selected as the data source type, otherwise it is a mandatory field.
-
Optionally add any filters to be applied to the data source. See Filters.
-
Save the changes and exit.
Editing a Data Source
To edit a data source, select the data source on the Data Sources page and select the Edit action. The data source record opens in edit mode in a new tab.
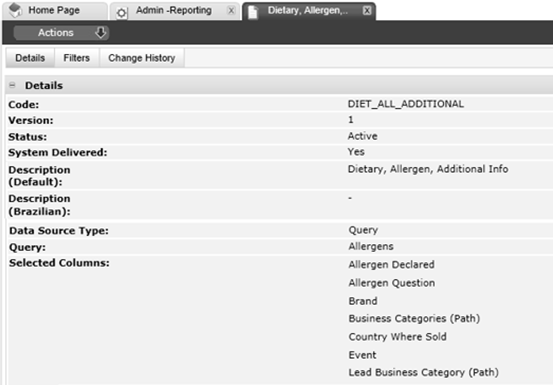
Data Sources are maintained as a versioned glossary. When the data source is created, it is assigned version 1 and the status will be Draft. At this status, all fields except the code, version, status, and system-delivered flag may be edited.
The system-delivered flag identifies if the record is part of the suite of delivered core reports, in which case the flag will be Yes. The system-delivered data sources may be copied using the Copy action to form new custom variants, in which case the flag will be No.
Figure 3-3 Data Source Details
Activating the Data Source
Use the Activate action to activate the data source. The status is changed to Active, making the data source available for use in report designs. At this status, no fields may be edited (see the note below), but the Create New Version action can be used to create a new version at Draft status, with the version automatically incremented by 1.
Deactivating the Data Source
Use the Deactivate action to deactivate the data source. The status is changed to De-activated, making it unavailable for use in new report designs. Any existing active report designs that use the data source will continue to do so. At this status, no fields may be edited (see the note below), but the Create New Version action can be used to create a new version at Draft status, with the version automatically incremented by 1.
Note:
Users with the Oracle Authorized Administrator authority profile can edit the record at any status, however the code, version, status, and system delivered flag remain locked.
Deleting the Data Source
Use the Delete action to delete the data source. The data source may only be deleted if it is not active and has not been used by any report designs.
Downloading Data for RTF Template Design
The Download Data for RTF Template Design action creates a file containing the data elements of the selected query. Use this option to download an XML file that can be used in the design of an RTF report template. For information on building RTF templates, see Appendix: Designing RTF Templates.
Filters
Filters can be applied to Data Sources, Report Designs, and Report Schedules to refine the data included in the report when it is run. If no filters are applied to a report, the data in the generated report will be all the records that the data source contains.
Data Source Filters
If a data source has a filter, it will be applied to all report designs and subsequent report schedules that use the data source. This type of filter is of use to always restrict data to a specific set, for example to provide a data source for reporting on Food products, where the filter only includes Food type products.
Report Design Filters
If a report design has a filter, it will be applied to all report schedules that use the design. This type of filter is of use to refine the data to a specific subset, for example to provide a design for reporting on active Food products, where the data source filters for Food products, and the report design filter then only includes those at an active status.
Report Schedule Filters
If a report schedule has a filter, it will be applied in addition to any data source or report design filters to further refine the data to a specific subset, for example to run a report for reporting on active Food products of a given category, where the data source filters for Food products, the report design filters for those at an active status, and the report schedule filters those for the required category (such as vegetables).
Applying Filters
Filters can be applied as fixed values (such as always selecting Food products), or as runtime values, where the user selects the value when scheduling the report to run (such as choosing which categories of product to include in that particular run of the report.)
The different levels of filtering allows for flexible, efficient, and intuitive report selection criteria to be designed. The filters are applied cumulatively: any Data Source filters AND any Report Design filters AND any Report Schedule filters.
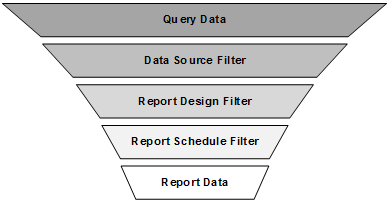
Filters are applied in the Filters page of the Report Data Source, Report Design, and Report Schedule records. Report designs also show any filters that have been applied at the data source level; report schedules show any filters that have been applied at the data source or report design level.
Each row in the table applies a single condition. For example, if the filter is to include products with status active or draft, the table will contain two rows:
(Status Equals Active) OR (Status Equals Draft)
To apply the same search for three named suppliers, the table would contain five rows:
((Supplier Equals ABC Supplies) OR (Supplier Equals DEF Supplies) OR (Supplier Equals XYZ Supplies)) AND ((Spec Equals Active) OR (Status Equals Draft))
To add a filter to a data source:
-
Open the data source in edit mode and navigate to the Filter page.
Figure 3-4 Filters Table

-
To add a row to the filters table, click Add.
-
Enter the details.
Table 3-2 Filters Table
| Details | Description |
|---|---|
|
( ) parenthesis |
The parenthesis columns are used to construct simple or complex statements, with and/or logic. Opening and closing pairs must match. |
|
Column |
Select from the available columns, based on the data source's query. |
|
Operator |
Select from the following options, based on the column type:
Note: The Editable Text Selector type glossaries, where variable inline values are entered into a predefined statement structure, cannot be used as filters. In this case, the only option for the Operator will be Blank, and the Value will contain the text Not available for this type of glossary. However, they do have corresponding text fields which contain the full constructed statement for reporting and filtering purposes. The statement is stored as a text string, in the specification’s pack copy language if specified (otherwise in the portal’s default language). |
|
Type |
Select from the following options:
For examples of usage, see Table 3-3. |
|
Runtime Value |
Check the box if the value is to be entered by the user when the report is scheduled. Otherwise, enter a fixed value in the value column. The box is unchecked by default. |
|
Ignore Case |
Check the box if the comparison value does not need to be case-sensitive. The box is checked by default; it only shows if the column is a text field. |
|
Value |
Enter the value to be applied by the operator. If the column is a lookup to a glossary, or an enumeration, use the picker to select a single value from the available options (see Figure 3-5). Options to filter and search the list appear at the top of the dialog box. Click Search to apply any selections. The paged list of available values shows the item description and code, along with its status in the glossary. For Specification glossaries, the contents are not populated until the specification type has been selected. When selecting values from the Ingredients glossary, a Spec Type column will indicate the specification type for each row in the picker. For enumerations (lists of keywords), a simple drop-down picker is used. For dates, a date picker is used. When the report is run, the time-zone of the user who scheduled the report is assumed. This field is disabled if the runtime value box is checked; it is hidden if the type is Relative and the unit is Run Date. |
|
Unit |
If the type is Relative and is a fixed value (not a runtime value), select from the options: Run Date; Day; Week; Month; Year. This field is hidden unless the type is Relative; if the runtime value box is checked, the field is disabled. |
Figure 3-5 Filter Selector
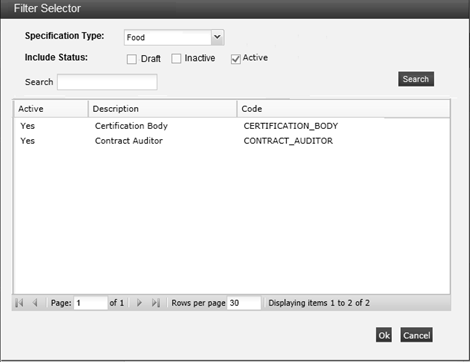
Table 3-3 Examples of Filters
| Filter | Column | Operator | Type | Runtime Value | Ignore Case | Value | Unit |
|---|---|---|---|---|---|---|---|
|
Is a Food specification |
Spec Type |
Equals |
Fixed |
N |
Y |
Food |
- |
|
Is a specific type of specification |
Spec Type |
Equals |
Fixed |
Y |
Y |
- |
- |
|
Created today |
Creation Date |
Equals |
Relative |
N |
- |
- |
Run Date |
|
Created in the last x days |
Creation Date |
Less Than or Equals |
Relative |
Y |
- |
[runtime value] |
Day |
|
Created in the last x |
Creation Date |
Less Than or Equals |
Relative |
Y |
- |
[runtime value] |
[runtime value] |
|
Not created this year |
Creation Date |
Not Equals |
Relative |
N |
- |
0 |
Year |
|
Approved in the last week |
Approval Date |
Less Than or Equals |
Relative |
N |
- |
1 |
Week |
|
Due in the next 2 months |
Due Date |
Greater Than or Equals |
Relative |
N |
- |
2 |
Month |
|
Due last month or next month |
Due Date |
Greater Than or Equals OR Less Than or Equals |
Relative |
N |
- |
1 |
Month |
|
List of dates includes the run date |
List of Dates |
Contains |
Relative |
N |
- |
- |
Run Date |
Filters for Specification and Audit API Data Sources
If the data source is Spec API or Audit API, an alternative filters table is presented, with the available filters being those that the associated Brand Compliance API provides.
Figure 3-6 API Filter Table

Table 3-4 API Filters Table
| Details | Description |
|---|---|
|
Column |
Select from the available columns, based on the API's filter parameters. |
|
Runtime Value |
Check the box if the value is to be entered by the user when the report is scheduled. Otherwise, enter a fixed value in the value column. The box is unchecked by default. |
|
Value |
Enter the value to be applied by the operator. If the column is a lookup to a glossary, or an enumeration, use the picker to select a single value from the available options (see Figure 3-5). Options to filter and search the list appear at the top of the dialog box. Click Search to apply any selections. The paged list of available values shows the item description and code, along with its status in the glossary. For Specification glossaries, the contents are not populated until the specification type has been selected. For enumerations (lists of keywords), a simple drop-down picker is used. For dates, a date picker is used. When the report is run, the time-zone of the user who scheduled the report is assumed. This field is disabled if runtime value box is checked. It is hidden if the type is Relative and the unit is Run Date. |
The filtering parameters available for the Specification API data source can be found in the Oracle Retail Brand Compliance Management Cloud Service Implementation Guide.
The filtering parameters available for the Audit API data source are as follows (data for Audits and Visits and their Non-conformances/Issues is returned, Checklist data is not returned):
-
Audit Code
-
Audit Template
-
Completed Date From/Until date range (searches the Status History table)
-
Due Date From/Until date range
-
Technologist (select from all users, list can be filtered to just retailer users)
-
Supplier (text field searches name and code for an exact match)
-
Site (text field searches name and code for an exact match)
Note:
The Brand Compliance APIs are optimized to just return data from the Product Specification or Audit/Visit record. There are therefore limitations on how much related data is available in the API data sources. For example, the status of the Site associated to a specification or audit is held on the Site record, so is not returned by the Specification or Audit APIs.
Query Costs and Weightings
In order to minimize the risk of reports with excessive content, validation is applied to limit the number of columns that can be selected based on the cost of a column.
Columns with a single value per output row have a cost based solely on the complexity of calculating the value (which for non-calculated columns is near zero); columns where there may be multiple values are significantly more expensive while columns where there may be multiple sets of multiple values are significantly more expensive still.
The columns selected in filters count toward the total, with each row in the filters table incurring a cost. If the limit is exceeded, the following message is shown: Maximum number of report columns exceeded. Please reduce the number of selected columns or filters. The maximum number of rows returned in a report is 200,000.
Data Warehouse Facility
In order to minimize the risk of performance hits on the application when running high-volume reports such as ingredient searches, a Data Warehouse facility is provided, where certain queries run on a copy of the data taken for reporting purposes rather than the actual application data.
The synchronization of the data takes place automatically, with the refresh interval being controlled by the Reporting Data Warehouse Update Interval (mins) system parameter. The initial default is 90 minutes; the minimum is 10 minutes.
The time it takes to refresh the data is the number of minutes set in the system parameter plus the length of time it takes to process the updates. This means that if a report is run, then a value in the report is changed within the application, and the report is immediately rerun, the change will not be reflected in the report if the refresh has not yet taken place. The refresh processing takes place in the reporting batch job queue, however controls are in place to prevent it consuming the queue.
Note:
Any reports that are submitted while the data warehouse refresh is running will be queued until the refresh is complete. On completion, the data warehouse refresh job is automatically rescheduled to run again in 90 minutes (or whatever interval is configured).
The reporting data source queries that are sourced from the data warehouse are as follows:
-
Ingredients Where Used (ING_WHERE_USED)
-
Ingredients Country of Origin (RAWM_ING_COO)
-
Ingredients Suppliers (RAWM_ING_SUP)
-
Ingredient Usage Quantity (ING_USAGE_QUAN)
-
Raw Material Sustainability (RAWM_SUSTAIN)
-
Surveillance As Consumed
-
Product Surveillance Test Report
Report Templates
Report Templates define the layout and data content of a report. Report templates are combined with data sources to form report designs which are scheduled to run as a report. A report template may be used in any number of report designs. Report Template records act as a container for the actual report template, which is a Rich Text Format (RTF file).
Note:
The supplied core report templates cannot be edited directly, but can be copied and adapted to form custom variants. The system-delivered templates cannot be deactivated or deleted.
To access the Report Templates, select the Manage Report Templates option in the Reporting Admin area. This is only accessible to users with the Advanced Reporting Administrator authority profile.
The list of report templates is displayed, grouped by status. A single Default list view is provided. For each template, the description, code, and version are shown. A column indicates if the template is one of the system-delivered core set.
Figure 3-7 Report Templates Page

To see the details for a specific template, double-click the row. A tab opens with the details. You can also select the View or Edit actions.
Note:
The Report Template records can be imported and exported using the Import and Export list view actions, however the RTF template files are excluded.
If using the Import action to create a new template, the system delivered flag must be set to No, otherwise the imported data source will not be editable.
Creating a Report Template
To create a new template:
-
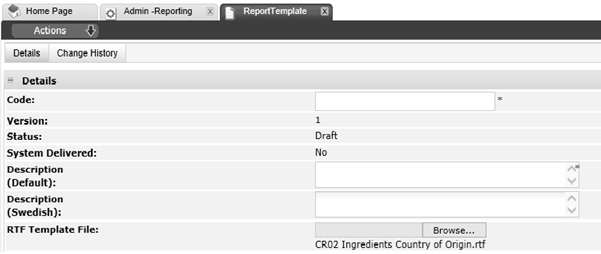
Select the New action. The New Report Template page appears.
Figure 3-8 New Report Template Page
-
Enter the details.
Table 3-5 New Report Template Page
Details Description Code
Enter a unique uppercase code for this template. Mandatory field.
Version
The version will default to 1. Read-only field.
Status
This will default to Draft. Read-only field.
System Delivered
This will default to No. Read-only field.
Description
Enter the description for this template in the supported languages. The description for the default language is mandatory.
RTF Template File
Click Browse to select a single RTF file to be used as the actual report template. The name of the selected file is then shown here. For information about RTF template files, see Appendix: Designing RTF Templates.
-
Save the changes and exit.
Editing a Report Template
To edit a template, select the template on the Report Templates page and then select the Edit action. The report template record opens in edit mode in a new tab.
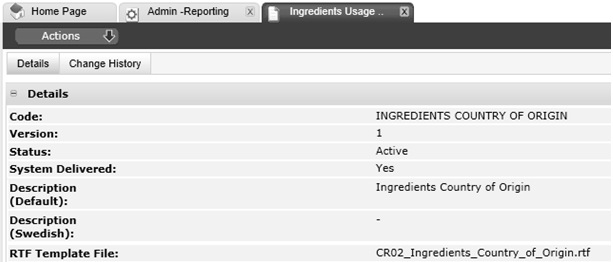
Report Templates are maintained as a versioned glossary. When the template is created, it is assigned version 1 and the status will be Draft. At this status, all fields except the code, version, status, and system delivered flag may be edited.
The system delivered flag identifies if the record is part of the suite of delivered core reports, in which case the flag will be Yes. The system delivered templates may be copied using the Copy action to form new custom variants, in which case the flag will be No.
Figure 3-9 Report Template Details
Activating the Report Template
Use the Activate action to activate the template. The status is changed to Active, making the template available for use in report designs. At this status, no fields may be edited (see the note below), but the Create New Version action can be used to create a new version at Draft status, with the version automatically incremented by 1.
Deactivating the Report Template
Use the Deactivate action to deactivate the template. The status is changed to De-activated, making it unavailable for use in new report designs. Any existing active report designs that use the template will continue to do so. At this status, no fields may be edited (see the note below), but the Create New Version action can be used to create a new version at Draft status, with the version automatically incremented by 1.
Note:
Users with the Oracle Authorized Administrator authority profile can edit the record at any status, however the code, version, status, and system delivered flag remain locked.
Deleting the Report Template
Use the Delete action to delete the template. The template may only be deleted if it is not active and has not been used by any report designs.
Downloading RTF Template Files
The Download Template action downloads the attached RTF template file. Use this option to download the actual template file for editing or creating a variant of the report. For information on building RTF templates, see Appendix: Designing RTF Templates.
Report Designs
Report Designs combine a data source with a report template to form a report that can be scheduled to run. A report design may be used in any number of report schedules.
Note:
The supplied core report designs cannot be edited directly, but can be copied and adapted to form custom variants. The system-delivered designs cannot be deactivated or deleted.
Filters can be used to refine the report design to a data set appropriate for a particular type of report.
To access the Report Designs, select the Manage Report Designs option in the Reporting Admin area. This is only accessible to users with the Advanced Reporting Administrator authority profile.
The list of report designs is displayed, grouped by status. A single Default list view is provided. For each report design, the description, code, query name, and version are shown. A column indicates if the design is one of the system delivered core set.
Figure 3-10 Report Designs Page

To see the details for a specific report design, double-click the row. A tab opens with the details. You can also select the View or Edit actions.
Note:
The Report Design records can be imported and exported using the Import and Export list view actions, however rows in the Filters table that relate to glossary selections or enumerations are excluded.
If using the Import action to create a new report design, the system delivered flag must be set to No, otherwise the imported report design will not be editable.
Creating a Report Design
To create a new report design:
-
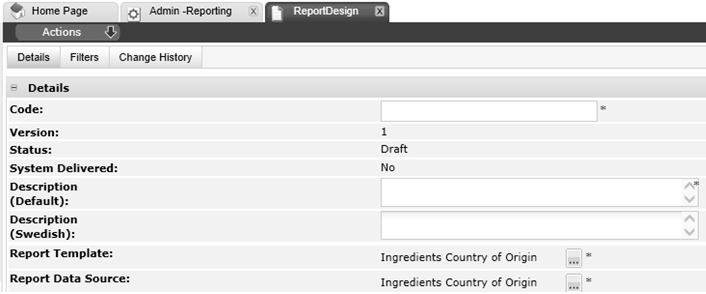
Select the New action. The New Report Design page appears.
Figure 3-11 New Report Design Page
-
Enter the details.
Table 3-6 New Report Design Page
Details Description Code
Enter a unique uppercase code for this report design. Mandatory field.
Version
The version will default to 1. Read-only field.
Status
This will default to Draft. Read-only field.
System Delivered
This will default to No. Read-only field.
Description
Enter the description for this report design in the supported languages. The description for the default language is mandatory.
Report Template
Click the icon to select the report template to be used for this report design.
Report Data Source
Click the icon to select the data source to be used for this report design.
-
Optionally add any filters to be applied to the report design. See Filters for Report Designs.
-
Save the changes and exit.
Editing a Report Design
To edit a report design, select the report design on the Report Designs page and select the Edit action. The report design record opens in edit mode in a new tab.
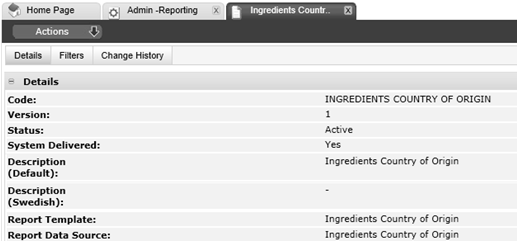
Report Designs are maintained as a versioned glossary. When the report design is created, it is assigned version 1 and the status will be Draft. At this status, all fields except the code, version, status and system delivered flag may be edited.
The system delivered flag identifies if the record is part of the suite of delivered core reports, in which case the flag will be Yes. The system delivered report designs may be copied using the Copy action to form new custom variants, in which case the flag will be No.
Figure 3-12 Report Design Details
Activating the Report Design
Use the Activate action to activate the report design. The status is changed to Active, making the report design available to report schedules. At this status, no fields may be edited (see the note below), but the Create New Version action can be used to create a new version at Draft status, with the version automatically incremented by 1.
Deactivating the Report Design
Use the Deactivate action to deactivate the report design. The status is changed to De-activated, making it unavailable to report schedules. Any existing active report schedules that use the report design will continue to do so. At this status, no fields may be edited (see the note below), but the Create New Version action can be used to create a new version at Draft status, with the version automatically incremented by 1.
Note:
Users with the Oracle Authorized Administrator authority profile can edit the record at any status, however the code, version, status, and system delivered flag remain locked.
Filters for Report Designs
Filters can be applied to report designs to refine the data included in the report when it is run.
The Filters page shows any filters that have been applied to the data source (these cannot be edited), above the table for adding filters to the report design. For information about adding filters, see Filters in the Data Sources section.
Figure 3-13 Report Design Filters

If the data source is Spec API or Audit API, an alternative filters table is presented, with the available filters being those that the associated Brand Compliance API provides.
When the report is run, the filters are applied as any data source filters AND any report design filters.
KPI Report Templates
A Key Performance Indicator (KPI) is a specific type of report where a single item of data can be aggregated over time to provide a measure which can be reported on or presented in a dashboard as a simple table or as a chart. An example of a KPI could be a weekly count of the number of active products or supplier sites, or the number of audits due to be completed in the next 30 days.
The KPI values are keyed by the Report Schedule Code and timestamp of when the KPI was measured. The KPI value can be selected as a data source to be included in a report template to define the actual KPI report, or presented in a dashboard.
KPIs are scheduled to run in the same way as reports; each time the KPI is run, the measure is calculated and stored. The values are stored in a separate KPI Results folder within the Report Outputs area. A KPI template may be used in any number of report schedules.
The aggregation function allows for measures to be calculated based on minimum, maximum or average values or the sum, count or number of distinct values in a set of data.
Filters can be used to refine the template to a data set appropriate for a particular type of KPI.
To access the KPI Report Templates, select the Manage KPI Report Templates option in the Reporting Admin area. This is only accessible to users with the Advanced Reporting Administrator authority profile.
The list of KPI report templates is displayed, grouped by status. A single Default list view is provided. For each template, the description, code, and version are shown.
Figure 3-14 KPI Report Templates Page

To see the details for a specific template, double-click the row. A tab opens with the details. You can also select the View or Edit actions.
Note:
The KPI Report Template records can be imported and exported using the Import and Export list view actions, however rows in the Filters table that relate to glossary selections or enumerations are excluded.
Creating a KPI Report Template
To create a new KPI report template:
-
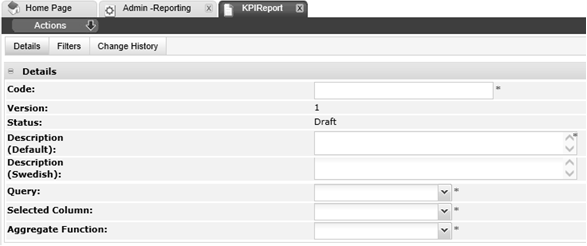
Select the New action. The New KPI Report Template page appears.
Figure 3-15 New KPI Report Template Page
-
Enter the details.
Table 3-7 New Report Design Page
Details Description Code
Enter a unique uppercase code for this template. Mandatory field.
Version
The version will default to 1. Read-only field.
Status
This will default to Draft. Read-only field.
Description
Enter the description for this template in the supported languages. The description for the default language is mandatory.
Query
Select the query that corresponds to the data to be measured by the KPI. Mandatory field.
The options in the list are fixed, based on the set of predefined queries provided by Oracle.
Selected Columns
Once the query has been selected, pick the column to be measured by the KPI. Mandatory field.
Aggregate Function
Select the aggregate function to be applied the KPI measure. Mandatory field.
The available options are:
-
Minimum - the minimum in a range of values
-
Maximum - the maximum in a range of values
-
Sum - the sum of a set of values
-
Average - the average of a set of values
-
Count - the number of occurrences in a set of values
-
Distinct - the number of unique occurrences in a set of values
The Sum and Average options are only available if the selected columns is a numeric field.
-
-
Optionally add any filters to be applied to the report design. See Filters for KPI Report Templates.
-
Save the changes and exit.
Editing a KPI Report Template
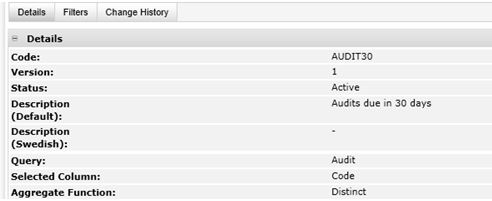
To edit a KPI report template, select the template on the KPI Report Templates page and select the Edit action. The template record opens in edit mode in a new tab.
KPI Report Templates are maintained as a versioned glossary. When the template is created, it is assigned version 1 and the status will be Draft. At this status, all fields except the code, version and status may be edited.
Figure 3-16 KPI Report Template Details
Activating the KPI Report Template
Use the Activate action to activate the template. The status is changed to Active, making the template available for use. At this status, no fields may be edited (see the note below), but the Create New Version action can be used to create a new version at Draft status, with the version automatically incremented by 1.
Deactivating the KPI Report Template
Use the Deactivate action to deactivate the template. The status is changed to De-activated, making it unavailable for use in new KPIs. Any existing active KPIs that use the template will continue to do so. At this status, no fields may be edited (see the note below), but the Create New Version action can be used to create a new version at Draft status, with the version automatically incremented by 1.
Note:
Users with the Oracle Authorized Administrator authority profile can edit the record at any status, however the code, version, status, and system delivered flag remain locked.
Filters for KPI Report Templates
Filters can be applied to a KPI template to refine the data included in the KPI when it is run.
For information about adding filters, see Filters in the Data Sources section.
Figure 3-17 KPI Template Filters

When the KPI is run, the filters are applied in addition to any filters that may have been applied when the KPI was scheduled.
Other Report Administration Options
Various other report administration options are available, for the purging of report outputs, monitoring the queue of scheduled report, and controlling the data warehouse synchronization.
Report Purging
Report outputs may be deleted individually by the user who scheduled the report, or by reporting administrators.
To avoid relying on users deleting their reports when no longer required, and in order to not store reports longer than necessary, an automated purging facility is available.
The purging of reports takes place automatically, with the retention period being controlled by the Number of days to keep Reports system parameter. The initial default is 90 days; the maximum is 365 days; if not set, no purging takes place. The parameter may be configured by users with the Oracle Authorized Administrator authority profile. If the parameter is changed, a message is shown, warning that changing the number of days that reports are retained may result in existing reports becoming due for purging.
If enabled, two daily batch jobs run on a regular schedule:
-
To check for reports that, based on the last update date, are due to be purged in the next 5 days. An email (the template is REPORTPURGE) is sent to the user who scheduled the report, warning that the report will be deleted within the next 5 days.
-
To delete reports that have reached the deadline for being deleted (that is x days after their creation date, where x is the system parameter).
Note:
The outputs of reports and data extract are eligible for automated purging, however the outputs of KPIs are excluded from the purge facility. They must be manually deleted when no longer required.
Monitoring Scheduled Reports
When reports are scheduled, they are submitted to run on the portal's batch job queue. Facilities are provided for users to view the progress of scheduled reports and to cancel a report that is scheduled or running.
Viewing Scheduled Reports
For system administrators with access to the batch job log, the description column in the log list view will include details of scheduled reports.
For users with the Advanced Reporting Administrator authority profile, a Manage Scheduled Reports option is available in the Reporting Admin area. This presents a subset of the batch job log, filtered to just show reporting jobs that are scheduled, in progress, complete, or have failed. It includes all reporting jobs, regardless of who submitted them. Also included are the jobs that synchronize the data warehouse reporting data.
Figure 3-18 Manage Scheduled Reports Page

To see the details for a job, double-click the row. A tab opens with the report's Report Schedule details. You can also select the Open Report Schedule action.
If the job is in progress, the sub status column indicates the stage of process, such as:
-
Stage 1 of 3: Counting results
-
Stage 2 of 3: Processing data
-
Stage 3 of 3: Creating output
Individual users who submit the report can monitor it through the Schedules page of the Report Schedule record. For details, see Scheduling Reports.
Cancelling Scheduled Reports
Users with the Advanced Reporting Administrator authority profile have the ability to cancel any reporting job through the Manage Schedule Reports page.
To cancel a scheduled report:
-
Choose the reporting job to be cancelled.
-
Select the Cancel action. The Confirm Cancel dialog box appears.
Figure 3-19 Confirm Cancel Scheduled Report
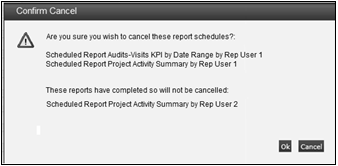
If multiple schedules have been selected, the confirmation prompt lists those that have been selected. If any cannot be cancelled because they have since completed, they are listed beneath.
-
To continue the cancellation, click Ok. To return to the Manage Schedules Report page, click Cancel.
When a report schedule job is cancelled, the job is terminated, or is removed from the scheduler if it has yet to run. The History page of the Report Schedule record will show the status as having been cancelled, and a notification email (the template is REPORT_CANCELLED) is sent to the user who scheduled the report.
Individual users who submit the report can cancel it through the Schedules page of the Report Schedule record. For details, see Scheduling Reports.
Note:
To prevent a recurring report from being automatically scheduled again, delete or edit its Report Schedule record.
Note:
Status shows the status of the batch job. Sub Status shows the status of the report generation, within the batch job.
In the event of an unexpected error during report generation, Status may show the batch job as completed, but with Sub Status showing as a failure.
A failure in either Status or Sub Status indicates the report has not run successfully.
System Parameters
To manage the parameters for reporting, select the System Control option and then System Parameters. Table 3-8 describes the available parameters.
Table 3-8 System Parameters Used to Manage Reports
| Subtab | Parameter | Description |
|---|---|---|
|
Global |
Number of days to keep Reports |
Sets the number of days a report will be retained after creation, before being deleted by the automated purging facility. The user who scheduled the report will receive an email notification 5 days prior to the deletion date. Default is 90 days. The maximum is 365 days. If not set, no purging takes place. |
|
Global |
Reporting Data Warehouse Update Interval (mins) |
Sets the data refresh interval for the synchronization of certain application data with a Data Warehouse for reporting purposes. Mandatory field. Default is 90 minutes. The minimum is 10 minutes. |
|
Global |
Reporting Server URL |
This parameter is only used if the legacy Jaspersoft reporting solution is being used alongside the Brand Compliance reporting solution during a period of transition. If a URL is present, the Legacy Reporting option will appear in the Reports navigation menu, as a link to the URL. |
|
Global |
Do not run Data Warehouse after |
These parameters allow for the data warehouse data synchronization to be suppressed during a time range. The selectors allow 30 minute time intervals to be selected; a specific valid time may alternatively be keyed. To run the synchronization continuously, the parameters should be set to the same time. To stop the synchronization entirely, set the range to 00:00 - 23:59 (by keying in the 23:59). Validation ensures that if a value is present in either, both must be valid times (between 00:00 and 23:59), and Before (to) cannot be earlier than After (from). |
|
Global |
Do not run Data Warehouse before |
Report Output Folders
When reports are generated, they are saved in a library of folders. A hierarchical structure of nested folders can be maintained. The library has three separate areas for the outputs of reports, KPIs, and data extracts.
The Report Output Folders can be created by users with the Advanced Reporting Administrator authority profile.
Note:
Folders cannot be added to the KPI Reports area, as they are managed by the system.
Figure 3-20 Report Output Folders Page

Creating a Report Output Folder
To create a report output folder:
-
Select an existing folder in the left hand pane, under which the new folder is to appear.
-
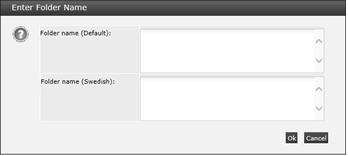
Select the New Folder action in the left hand pane. The Enter Folder Name dialog box appears.
Figure 3-21 Folder Name Dialog Box
-
Enter the folder name and any language translations.
-
To continue, click Ok. To return to the Report Outputs page, click Cancel.
Editing a Report Output Folder
To change the name of a report output folder or to add language translations:
-
Choose the folder and select the Edit Folder action in the left hand pane. The Folder Name dialog box appears.
-
Enter the new name and any language translations.
-
To continue, click Ok. To return to the Report Outputs page, click Cancel.
Deleting a Report Output Folder
To delete a report output folder:
-
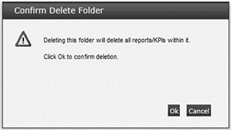
Choose the folder and select the Delete Folder action in the left hand pane. A delete confirmation dialog box appears. If the folder contains report outputs, they will also be deleted, in which case the message Deleting the folder will delete all reports/KPIs within it is shown.
Figure 3-22 Confirm Delete Folder
-
To continue with the deletion, click Ok. To return to the Report Outputs page, click Cancel.