B Appendix: Designing RTF Templates
This appendix provides instruction and best practices for the creation of the Rich Text Format (RTF) templates that form the basis of reports.
The recommended method for creating RTF templates is using the Oracle BI Publisher Template Builder plug-in for Word. This appendix provides information on installing the plug-in, along with guidance and examples for building templates for different types of reports, using the core Brand Compliance style.
The following topics are covered in this appendix:
For a summary of the reports supplied as part of the core suite of default core reports, see Appendix: Report Layouts. For further details of the layout of each report layout, see Oracle Retail Brand Compliance Management Cloud Service Report Layouts.
Types of Reports
There are three distinct types of report in Brand Compliance, referred to as Tabular Reports, Form Reports, and KPIs.
Tabular Reports
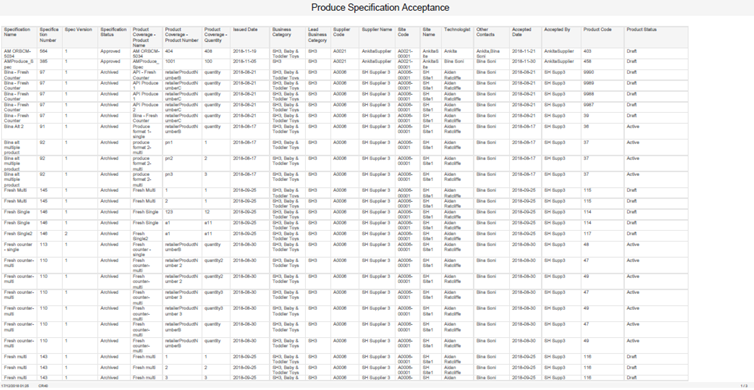
This type of report presents data in a tabular format where each row of the table represents an item at the level of the report's granularity - such as a row per supplier, a row per Product specification, or a row per ingredient within the product's recipe.
Figure B-1 Sample of a Tabular Report Layout
Form Reports
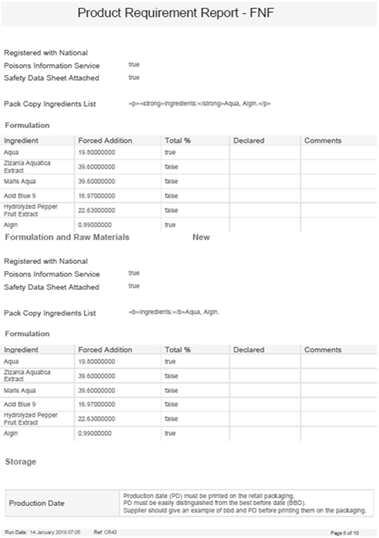
This type of report presents the data in a form layout, where each page or set of pages represents an item. The pages of the form can contain individual fields as well as tables. Examples of form reports are Specification Reports, where a variety of information about a product is collated within a reporting, and Audit Certificate reports, where details of a supplier's latest audit and any non-conformances are presented as a report.
Figure B-2 Sample of a Form Report Layout
KPIs
An alternative to a report is a KPI, which measures a single value, typically over a period of time. KPIs can be represented as reports, or as dashboard table or chart. KPI templates are configured in a similar way to report templates.
Figure B-3 Sample of a KPI Dashboard

The creation of a KPI is a two-stage process: the collection of the data and the display of the data:
-
The KPI data is collected by configuring a KPI Template to measure a particular value. For example, to measure the number of audits due for completion, the Audits query would be used, with a filter of audit status and due date, and a count of the unique audit code. The template is scheduled to run on a periodic basis so as to generate the KPI measurements. These measurements are stored in the system as KPI report outputs.
-
The collected data is then reported as a KPI dashboard app on the Home page, either as a table of values, as a line graph, or as a bar chart.
The KPI data may also be presented as report, by scheduling a report design that is based on a template that has the KPI as a data source, with a filter.
The system-delivered KPI data source (the code and description is KPI) is configured with the query set to KPI, and columns for Duration, Ran On, Report Folder, Scheduled By, Value (Number only), Value (Text only), and value (Text or Number as Text). A filter is present which prompts for the report output folder as a runtime value. This data source can be used (or copied and adapted) to schedule a report based on a KPI value; the report folder selected when scheduling the report determines that KPI measurement data to be used in the report.
To schedule a KPI as a report, an RTF report template will need to be designed and loaded to the system as a Report Template record and combined with the KPI data source using a Report Design record which can be scheduled - all in a similar way to how the standard reports are designed and scheduled.
BI Publisher Template Builder Plug-in for Word
The Oracle BI Publisher plug-in for Word (also known as Template Builder) is an extension of Microsoft Word. It aids the development of RTF documents for use as templates of BI Publisher reports. RTF templates can be created without Template Builder, but using it provides an easier way to build, preview, and validate templates, and has the capability of creating XLIFF language translations.
Installing and Launching Template Builder
To install the latest version of Template Builder from Oracle:
-
Download the executable file from:
http://www.oracle.com/technetwork/middleware/bi-publisher/downloads/index.html -
Accept the License Agreement.
-
Select the link appropriate to your version of Word (if the 64-bit installation has presentation issues, try the 32-bit version).
-
Save and/or run the BI Publisher Desktop exe file.
Once installed, the BI Publisher ribbon appears within Word.
Figure B-4 Word Ribbon with BI Publisher Plug-in Installed

Template Builder Tutorial
The Template Builder plug-in comes with a set of tutorials with sample data. The Balance Letter sample demonstrates the creation of a simple form containing a table; the Sales Report sample demonstrates the use of charts.
The Report Designer's Guide for Oracle Business Intelligence Publisher user guide provides full details on designing and building BI Publisher reports. The guide can be located by clicking Start / All Programs / Oracle BI Publisher Desktop / BI Publisher User Guide.
Balance Letter Sample
This example shows how data is inserted into a form layout using form fields from an XML data file.
-
Open the sample template from the Windows start menu by clicking Start / All Programs / Oracle BI Publisher Desktop / Samples, then select RTF Templates / Balance Letter / Balance Letter Start.rtf.
Alternatively, the file can be opened directly from the Samples folder where Template Builder was installed, such as: C:/Program Files (x86)/Oracle/BI Publisher/BI Publisher Desktop/Template Builder for Word/samples
-
Load the XML data to be used with the template by clicking Load Data / Sample XML within the BI Publisher ribbon.
Locate the Balance.xml file in the same location as the template; click Open. You should receive a Data loaded successfully message.
-
Insert the data bookmarks into the form by clicking Insert / Field and selecting the required field.
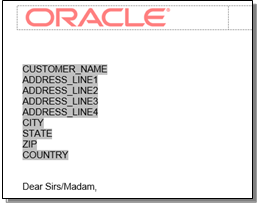
Start by placing the cursor at the <INSERT_ADDRESS_HERE> placeholder in the form and replace it by selecting the Customer Name and related Address fields from the dialog box, clicking Insert (or by dragging the field) to add each one individually.
The form should then look like Figure B-5. Continue inserting the AS_OF_DATE, TRX_CURRENCY_CODETRX_CURRENCY_CODE, and C_INV_OPEN_BALANCE fields at their placeholders.
Figure B-5 Balance Letter Fields Added
-
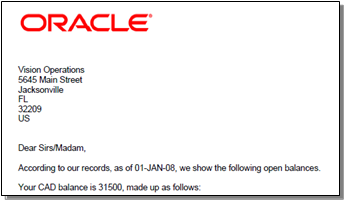
The form can now be previewed as a PDF file by clicking Preview / PDF, or as any of the other formats. The preview presents the form with sample data from the selected XML file inserted into the form fields.
Figure B-6 Balance Letter Preview
-
A table of data can now be added to show a list of invoices.
To select the data to show in the table, click Insert / Table Wizard, select Table as the report format and click Next. Then select the //ARXCOBLX/G_CUSTOMER/G_CURRENCY/G_INVOICES data set.
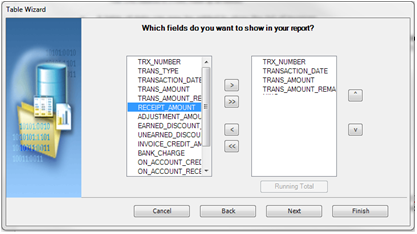
Clicking Next presents the list of available fields to appear as column in the table. Individually select Trx Number, Transaction Date, Trans Amount, and Trans Amount Remaining in the left hand pane, clicking > to add them to the right hand pane (the order of the selected columns can be changed using the up and down buttons).
Figure B-7 Table Wizard Dialog Box
-
Click Finish (clicking Next will present advanced grouping or sorting options). The table appears in the form per Figure B-8.
Figure B-8 Balance Letter Table

Note that F and E appear at the start and end of the row respectively to indicate a repeating section. The order of the columns may be edited directly in Word, however the F and E must always remain in the first and last columns.
-
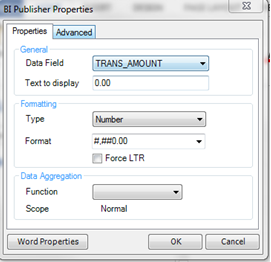
The table may be formatted using the Word options for changing font, size, position, bold/underline, color, and so forth. Fields may be further formatted by selecting the field, right-clicking, and selecting BI Publisher / Properties. The Properties dialog box allows the field to be specified as a Text, Number, or Date type (which can show the Current Date or Current Time), with formatting options appropriate to the field type.
Set the TRANS_AMOUNT column to be a Number with #,##0.00 formatting, appropriate to showing the value as a currency amount. A default value can be entered in the Text to display field.
Figure B-9 BI Publisher Properties Dialog Box
-
Click OK to apply the formatting. The field name in the table will be replaced with the formatted value, but can be seen in the Properties dialog box, or in the column heading. The column heading may be edited to be more descriptive.
Set the Transaction Date, Transaction Amount, and Transaction Amount Remaining columns to the appropriate data type, with formatting, and edit the column headings, for the table to appear in the form per Figure B-10.
Figure B-10 Balance Letter Properties Dialog Box

-
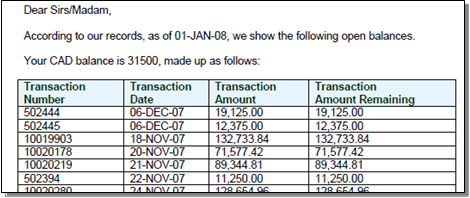
Preview the form again to see the table, populated with data, and then save a local copy of the completed RTF template.
Figure B-11 Balance Letter Preview
Sales Report Sample
This example shows how tabular data can be presented as a chart within a report template.
-
Open a new Word document and load the XML data to be used by clicking Load Data / Sample XML within the BI Publisher ribbon.
-
Locate the RetailSales.xml file from RTF Templates / Sales Report / Retail Sales.rtf in the same location as Step 1.
-
Click Open. You should receive a Data loaded successfully message.
-
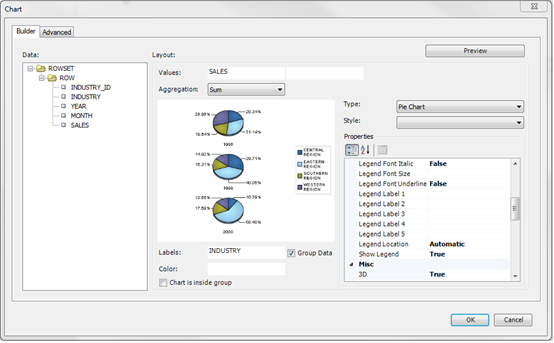
Now select Insert / Chart to open the Chart dialog box.
Figure B-12 Chart Dialog Box
-
Drag Sales in the left hand pane to the Values field to set data to be shown, and drag Industry to the Labels field to set how the values are to be accumulated.
-
Click Preview to see how the chart will be presented.
-
Click OK. The chart will be inserted into the form per Figure B-13.
Figure B-13 Sales Report Chart
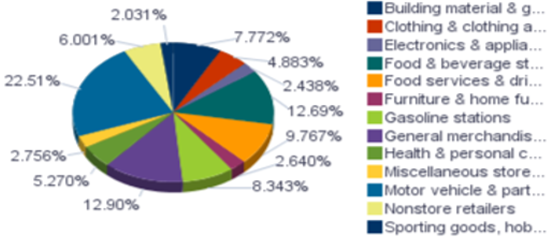
The size of the chart can be changed by resizing the placeholder image.
-
The form can now be previewed as a PDF file by clicking Preview / PDF, or as any of the other formats.
-
Save a local copy of the completed RTF template.
Building RTF Templates
This section provides guidance on building RTF report templates.
The key steps are to first decide the type of report to be built (whether it is a table of a form based layout, see Types of Reports), to locate the data source for the report, then to create the RTF file, build the content, apply formatting and styling, and finally to preview the finished report.
Further details on designing and building report templates can
be found in the Oracle Business Intelligence Publisher Report Designer's
Guide and Report Designer's Guide for Oracle Business Intelligence
Publisher documents, located at https://docs.oracle.com.
Locating the Data Source
Before creating a report template, you must locate the data source in the form of an XML file. This provides the data structure of the report.
The XML files are downloaded from their Report Data Source records (see Data Sources). Open the data source record and use the Download Data for RTF Template Design action to save the file locally for use when building the template.
Creating an RTF Template for a Table Report
The following instructions are for creating an RTF template for a table report using Template Builder. For details on installing the plug-in, see Installing and Launching Template Builder.
-
Create a new Word document and click Sample XML in the BI Publisher ribbon.
An alternative is to copy an existing RTF template and amend accordingly.
-
Select the data source XML file and click OK to load the data definition. The Data loaded successfully message is shown.
-
Set the page size to suit the report, typically A3 landscape with narrow margins.
If necessary, change to a custom page size, such as 55cm x 30cm under Page Layout / Page Setup / Paper changing the paper size to Custom size and setting the width and height as required (the maximum is 55).
-
Add a report title in the document header, the current date and time, and page number functions in the document footer, along with an identifier for the report.
-
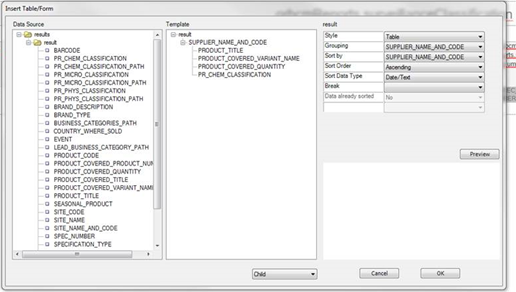
Insert the table in the body of the document by clicking Table/Form. The Insert Table/Form dialog box opens.
Figure B-14 Insert Table/Form Dialog Box
Note:
An alternative method for adding a table is to click Table Wizard and follow the steps to create the table, or use the regular Word options to manually insert an empty table, click Field Browser to insert fields in columns individually, highlight the row, and click Repeating Group.
If the template has been created by copying an existing RTF file, insert a new temporary table beneath the existing table, then copy the contents of the columns into the existing table before removing the temporary table.
-
Drag the result node from the Data Source pane to the Template pane, selecting the Drop Single Node option when prompted. Repeat for the other fields to appear as columns in the table.
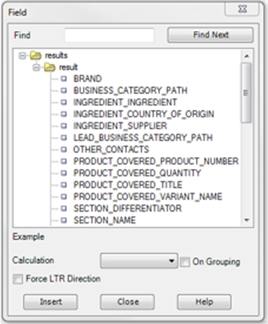
Alternatively, choose the Drop all nodes to copy all fields across and then drag back any that are not required. Fields can be individually added/removed later if necessary by clicking Field Browser.
Figure B-15 Field Browser Dialog Box
Note:
If the report is grouped by the first column, as the rows are not repeated, the repeating group should start with the second column and this is where the remainder of the sorting should be applied. If a column is grouped, any sorting in that column should be for the grouping itself. See report CR31c for an example.
-
Set any grouping and sort sequence by clicking the result node and setting the Grouping and Sort by options with the appropriate columns.
If grouping is required, select the field to group by in the right-hand properties box. Also, set its sort sequence and data type. Leave the Break option blank. If secondary sorting is required, select the grouping field, and in the right-hand properties box, select the next field to be sorted, the sort sequence and data type. Up to four levels of sorting can be set.
If sorting is required in a non-grouped table, or additional levels of sorting are required in a grouped table, you can apply the sorting after the table has been applied.
If adding grouping to a report that already contains a table (for the above method of adding a temporarily table), add the grouped column plus others then copy the first and last columns to the main table and complete the other columns.
-
Click OK to create the table.
Markers are inserted in columns, such as F and E, to indicate the first and last columns for a repeating group, and G to indicate a grouping column.
-
If a count is required at the end of the report, select Insert / Field, choose the field, then Count as the Calculation. When the count is inserted, double-click and set the Format to 0, to show as an integer. Add a field label prefix to the count. By default, only the number of data row occurrences are counted, not the distinct occurrences or number of groups.
-
If a chart is required, click Insert / Chart and then select the values and labels by dragging from the Data list. Chose the chart type and any other formatting, then add a label.
-
Click Tools / Validate Template to check for errors.
-
Apply formatting and styling, such as resizing or rearranging the table columns as required - including replacing the headings and other fixed text with links to the Brand Compliance system text, to allow for the dynamic translation for supported languages.
Further details on some of the options available for formatting and styling can be found in Formatting Report Contents, System Text and Language Translations, and Style Guidelines.
-
Save the document as a Rich Text Format type.
-
Preview the report by clicking Preview and then choose a format. If system text keys are used, the preview does not look up the column headings and fixed text, so the system text keys will continue to show.
Creating an RTF Template for a Form Report
An RTF template for a form report is created in the same way as described in Creating an RTF Template for a Table Report, with the following additional considerations:
-
The page size and orientation will typically be A4 portrait rather than A3 landscape.
-
The report body may contain a combination of individual fields (with their field labels), small tables, and static text.
-
Individual fields can be organized by manually creating a two column table (with no borders), with the fields added individually to the right hand columns by clicking Insert / Field, with the field labels placed in the adjacent left hand column.
Figure B-16 shows how data elements in the XML file are mapped to placeholders in the RTF template when the report is run.
Figure B-16 XML Data to RTF Template Mapping

-
If the report is to contain multiple records, the form will need to be specified as a repeating group, by selecting the body of the report and clicking Repeating Group.
Formatting Report Contents
This section describes some of the formation options that have been used in the suite of core reports, with guidance on their usage.
The positioning of data within the report template is achieved by bookmarking. The design of the report layout can include formatting of text and tables, and the insertion of images and charts. Conditional formatting and logic may also be included.
General Considerations
-
For information on the core default style and catering for language translations, see Formatting Report Contents, System Text and Language Translations, and Style Guidelines.
-
Use the standard Word formatting options for applying formatting such as font styles, alignment, table borders, page headers/footers, page numbering, date, and time.
-
Set table header rows to repeat on page break.
-
Place report headers and footers and record counts within a single table cell (with no borders), otherwise, issues can occur with system text being derived and extraneous columns being added in Excel format.
-
Where a report includes details of a record being linked to a Project, the Linked Project fields available to be included as columns are Project Id, Project Name, Activity Id, and Activity Name.
-
Data from the API data sources has namespace markup (ns0 / ns1 / ns2 prefix tags) automatically removed so it should not be necessary for any additional coding in the RTF templates.
-
Images may not render within headers and footers.
-
There is a known limitation in the output of bulleted and numbered lists in BI Publisher reports. This affects the rich text fields with CK Editor text formatting options, and results in the bullet point or number being omitted or replaced with a question mark. Typical rich text fields are in the Product Specification: Preparation, Serving and Recipe Suggestions, On Pack Ingredients, FPS Standards, Process Controls and Custom RTF fields. For list formatting in these fields, manually number the list, or use a character such as a hyphen as an alternative to a bullet point.
BI Publisher Properties
-
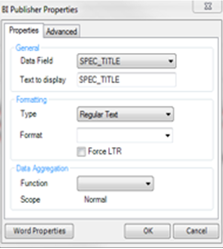
Right-click on field and select BI Publisher / Properties to apply data type and formatting for numbers and dates, and for applying data aggregation functions.
Figure B-17 BI Publisher Properties Dialog Box
-
The default date format used is dd-mmm-yy (for example 2-Jun-18).
-
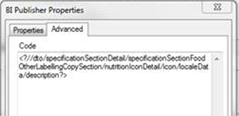
The Advanced tab in the Properties dialog box can be used to apply more advanced functions to data field location, formatting, and aggregation.
Figure B-18 BI Publisher Advanced Properties Dialog Box
-
When specifying the location of a data field, if the field name is not unique or the field is a column within a table, it may be necessary to specify the full path or a partial path. Notation can also be used to specify a relative path. Fields that have language translations may be contained within a localeData element.
Examples of specifying the varying levels of path for a description field are as follows:
Full Path:
<?//dto/specificationSectionDetail/specificationSectionFoodMainDetailsSection/brand/localeData/description?>
Partial Path:
<?specificationSectionFoodMainDetailsSection/brand/localeData/description?>
Locate Data Element:
<?brand/localeData/description?>
<?../brand/localeData/description?>
<?./brand/localeData/description?>
Data Element Only:
<?description?>
The meaning of the dot and slash notation is as follows (see the Oracle Business Intelligence Publisher Report Designer's Guide for full details):
/ Absolute (separates child elements)
// Root (all elements)
. Current node
.. Parent node
Conditional Formatting
-
To apply conditional formatting, select the field, label, or table and click Conditional Format. Open the Properties dialog box to apply the conditions and formatting.
Repeating Groups
-
The Repeating Groups facility is for constructing tables and form reports where more than one record may be present in the report. Individual fields that contain multiple values must also be defined as a repeating group for all values to be shown.
-
To create a repeating group, select the field, table, row, or the block of content to be repeated and click Repeating Group.
-
Select Absolute Path if the XML contains the same element names within different parent elements.
-
Set any grouping or sorting requirements and then click OK.
-
Repeating groups are shown between each (F) and end (E) markers.
-
Once the repeating group has been applied, it can be amended by right-clicking the F or G marker and opening the BI Publisher Properties dialog box.
The Advanced tab contains the code equivalent of the rules, which can also be edited.
-
Product Specifications may have multiple occurrences of a section, in which case a section name is entered in the application to identify them. If this is to be included in the report, it is a name element, located within specificationSectionDetail. The path must be specified in the properties box as:
<? ../name?>.
Grouping
-
Grouping is used to categorize a table within a report so that rows with a common value appear together. Grouping is applied when the table is created using the Table Wizard or Table/Form options.
-
In the Table Wizard, there are grouping options for Group Left and Group Above. Group Left creates a nested table. Group Above creates a new table for each new value for the grouping field, displaying the value of the group by field as the table title.
-
The grouping is contained within G and E markers.
-
When selecting an element to group by, the report is sorted by the grouping. Checking the Data already sorted option improves performance.
Sorting
-
The rules for the column sorting sequence of tables is applied when the table is created using the Table Wizard or Table/Form options. Up to four levels can be sorted.
-
Select the appropriate data type. Note that alpha 12 will come before 2; numeric 2 will come before 12; numeric will come before alpha. The default BI Publisher sort sequence orders all upper case before lower case.
To override the default sort sequence, so that uppercase and lowercase appear together:
-
Open the BI Publisher Properties dialog box for the column that applies the sorting.
-
In the Advanced tab, edit the field name as per this example:
Current Code:
<?sort:SPEC_TITLE;'ascending';data-type='text'?>New Code:
<?sort:(xdoxslt:convert_case(SPEC_TITLE,'UPPER'));'ascending';data-type='text'?>Note:
If the field is part of a group, replace the
current-group()/<column name>part of the statement with(xdoxslt:convert_case(current-group()/<column name>,'UPPER')). For example:Current Code:
<?sort:current-group()/SCORECARD_TEMPLATE;'ascending';data-type='text'?>
Updated Code:
<?sort:(xdoxslt:convert_case(current-group()/SCORECARD_TEMPLATE,'UPPER'));'ascending';data-type='text'?>
-
Click OK to close the Properties dialog box.
This will apply a sort sequence of numeric / lowercase / uppercase. For example, changing the default sequence of:
9876;A0001;R1234;a0001,r9001to:9876;a0001;A0001;R1234;r9001. -
-
If sorting by all four columns and if the XML tag names are excessively long, it is possible to exceed the maximum permitted 393 characters.
Counts
-
The Count calculation counts the number of occurrences of the field within a group.
-
If a count is required at the end of the report for a distinct number rather than total count, use for example:
<?count(xdoxslt:distinct_values(PRODUCT_COVERED_PRODUCT_NUMBER))?>
-
To add a total to a grouping, create the grouping and add the field, setting as a calculated value, check the On Grouping option, and then paste into the grouped cell.
Charts
-
To add a chart to a report, click Chart and set the following parameters:
-
Values - the data values to measure (may be multiples, depending on the chart type).
Combination Graph, Scatter Graph, Bubble Graph, and Stock Graph allow for multiple values.
Can choose to calculate sum count or average values.
-
Labels - the data elements for which the values are to be charted.
-
-
Can select to group the label elements before displaying in the chart (for example, to consolidate values by month or year).
-
By default, the data will be grouped by the Value element and aggregated by Sum. Deselecting the Group Data checkbox shows each occurrence of the Value element and aggregation functions will not be available.
-
Can choose to insert a chart within a group so that it only contains data for the group.
Boolean Fields and Conditional Regions
-
Boolean fields are stored in the database as true or false values. When included in reports, the values typically are required to show as Yes or No. This is achieved by applying conditional formatting, where the value is hidden unless the condition is true.
-
In the template, add two fields: orbcmReports.true and orbcmReports.false. Use font size 9.5 and avoid any whitespace.
-
Select each individually and click Conditional Region.
-
In the BI Publisher Properties dialog box, set the data type to Date/Text and the Data field values to Equal to true for orbcmReports.true and Equal to false for orbcmReports.false.
The fields are contained within C and EC markers. Double-clicking the C marker (or right-clicking and opening the BI Publisher Properties dialog box) allows the properties to be edited.
-
Further conditional logic can be applied if required, in the Advanced tab, for example:
<?xdofx:replace(seasonalProduct,'false','No')?>
<?xdofx:decode(seasonalProduct,'true','Yes','false','No','')?>
<?xdofx:decode(seasonalProduct,'true',orbcmReports.true,'false',orbcmReports.false,'')?>
-
Editable Text Selector and Enumeration Fields
-
Editable Text Selectors are the selectors in Brand Compliance that allow glossary selections to be made with variable content inserted. They allow for the consistent wording of statements without the need to create numerous glossary entries.
For example, a statement Caught in {c}, packaged in {c} could be configured in the glossary, then when selected for use in the Specification, the user substitutes {c} with the relevant country. The statement and parameter values are stored separately in the database and in the Specification API XML data. In order for these statements to be readable in reports, an additional packCopyText element contains the fully formed statement.
-
Enumerations are fields that are selected from a set of predefined options which are not configurable glossaries, for example Yes/No or Day/Month/Year.
In the XML returned from the APIs for Audit and Specifications, enumerations have an element for the code, an element for the description (in the selected language) and an element for the description in the specification's pack copy language, for example:
<specType>FOOD</specType>
<specTypeDescription>Food</specTypeDescription>
<specTypePackCopyDescription>Food</specTypePackCopyDescription>
HTML Markup
-
For fields that contain HTML markup, such as the Ingredients List, add the
html2fo:prefix to the path, for example:<?html2fo:productSpecificationFullDTO/specificationSectionDetail/specificationSectionFoodRecipeAndRawMaterialsSection/businessLanguageIngredientsList?>
-
If a text field contains formatting such as bullet points, the formatting will only render if the XML data is wrapped in a CDATA tag with the necessary formatting tags. In the RTF template, the path must also include the
?html2fotag (as above).If coded appropriately in the XML, the HTML formatting features supported by BI Publisher are as follows (see the Oracle Business Intelligence Publisher Report Designer's Guide for full details):
-
Hyperlinks
-
Lists
-
Bulleted and ordered lists
-
Paragraph
-
Font style (bold, italic, plain, underline, subscript, superscript, strike-through)
-
Font size and family
-
Background and foreground colors
-
Paragraph alignment (center, left, right, and justify) and indent
-
Pivot Tables
-
Pivot tables represent data within multiple categorizations, such as totals per area, summarized by year and by month.
Figure B-19 Example BI Publisher Pivot Table

-
To add a pivot table, click Insert / Pivot Table and drag the required categorization or grouping data elements from the left pane to the right-hand Layout pane.
-
Set the type to Sum or Count and click OK to add the table.
-
Apply any formatting or styling required. Ensure the column widths are sufficient, otherwise the data will be truncated.
Considerations for Excel
When designing RTF templates for reports that may have the output opened as an Excel workbook, the following points should be considered:
-
The data source XML file must not contain whitespace padding, otherwise extraneous blank rows can appear in Excel.
-
The report header and footer areas that contain the report title, run date, reference, and page number must be contained within a single cell. The presence of multiple columns results in extraneous columns appearing in Excel. The same applies to chart sub-headings.
-
The data row of a table must not contain extraneous spaces or carriage returns where the field is inserted (or between multiple fields), otherwise extraneous blank rows or columns can appear in Excel.
The Show/Hide
 option can be used in Word to check for spaces and carriage returns when editing the RTF template.
-
When adding columns to a table, if the table exceeds the page width to the right, it can result in extraneous blank rows or columns can appearing in Excel. Avoid this by containing the table in a single cell (with no borders). The same can occur when copying tables from one RTF template to another.
System Text and Language Translations
This section describes how the Brand Compliance system text facility is used to present fixed text within reports, and the translation of report content for the portal's supported languages, covering the following topics:
Translation of Report Content
When a report is run, the output (field labels, column headings, and data) is generated in the language specified by the locale of the user that scheduled the report.
In order to translate system text within the generated reports, the RTF report template must contain a means of linking the field label or column heading to a Brand Compliance System Text item. The language translations are achieved using an XLIFF file, which is generated in Brand Compliance, and is then bound to a report's RTF template, providing the necessary references.
The translation is achieved using the system text key generated by Brand Compliance. The keys are in a human-readable form (in English), so the report designer can identify the labels within the RTF at a glance. This approach also caters for where a portal has overridden the core system text to use client-specific terminology.
When a report is run, the XLIFF file applies the language translations. The labels and column headings in the report are automatically translated to the user's language, with the usual fall-back to the base language where translations are not present. The translation of data within the report, for fields that are derived from a glossary, are also automatically translated to the user's language, with the fall-back rules applied.
Configuring System Text and XLIFF for Reports
When a report administrator edits the RTF report template, rather than hard-coding the text for field labels and column headings, keys to items of System Text are used The keys are substituted with translations appropriate to the user when the report runs. The process for locating the appropriate system text keys, and creating those that do not exist is as follows:
-
A separate area of system text is provided specifically for use in reports, with a prefix of orbcmReports.
-
Whenever the Brand Compliance System Text is updated, a new XLIFF file containing the translations of fixed text used in reports is automatically generated (a separate file for each of the portal's supported languages).
-
The XLIFF file is downloadable from the System Text Admin area (by system administrators) and from the Reporting Admin area (by report administrators). The file contains the existing system text used in reports.
-
The report designer refers to the XLIFF file to locate the appropriate system text key and uses that rather than fixed text in the RTF template. The XLIFF file can be viewed using a text editor, such as Notepad++. The system text keys are located by simply searching for the relevant text.
An example of a simple XLIFF file, where the source element is field label and the target element is the system text is as follows:
<xliff version='1.0'> <file source-language='en-GB' target-language='en-GB' datatype='biprtf'> <header/> <body> <trans-unit id="orbcmReports.activeIngredients"> <source>orbcmReports.activeIngredients</source> <target>ACTIVE INGREDIENTS:</target> </trans-unit> <trans-unit id="orbcmReports.additionalConsumerInformation"> <source>orbcmReports.additionalConsumerInformation</source> <target>ADDITIONAL CONSUMER INFORMATION:</target> </trans-unit> </body></file></xliff> -
If a label or piece of text to appear in the report cannot be found in the XLIFF, it must be added to the System Text area for Reports in the Admin area. This can be done by a user with the System Text Administrator authority profile. When the system text is updated, new XLIFF files are automatically generated.
-
See Configuring System Text in RTF Report Templates for further details, including dealing with multiple occurrences of a system text label within a report, where a separate system text key is required for each occurrence.
-
When the template is complete and the report is run, the system combines the XLIFF and RTF files to derive the translations for the required language.
Configuring System Text in RTF Report Templates
In order to enable the translation of a report's field labels and column headings into the language of the user's locale, the RTF report template uses placeholders instead of hard-coding the text. The placeholder is the code to an item of configurable system text.
For example, a table that shows a Site's Certificates, such as:
| Type | Certificate No. |
|---|---|
|
EC Licence Number |
123456 |
|
Organic Certification |
987654 |
May be coded in the RTF template as:
| orbcmReports.type | orbcmReports.certificateNo |
|---|---|
|
F description |
referenceCertNo E |
Where orbcmReports.type is the key to the system text for the Type label, and orbcmReports.certificateNo is the key for the Certificate No. label.
System Text Translations
When coded accordingly, the report run by an English user would present the table as:
As Sold
| Attribute | Red | Amber | Green |
|---|---|---|---|
|
|
|
|
|
And run by a French user would present the table as:
Non préparé
| Attribut | Rouge | Ambre | Vert |
|---|---|---|---|
|
|
|
|
|
Duplicated Text
If the RTF template contains multiple occurrences of item of text, such as Product Attributes for As Sold and As Consumed values, each with Red, Amber, and Green column headings, the placeholders must contain unique values, typically by appending an incrementing number, such as:
orbcmReports.asSold
| orbcmReports.attr | orbcmReports.red | orbcmReports.amber | orbcmReports.green |
|---|---|---|---|
|
F description |
red |
amber |
green E |
orbcmReports.asConsumed
| orbcmReports.attr_2 | orbcmReports.red_2 | orbcmReports.amber_2 | orbcmReports.green_2 |
|---|---|---|---|
|
F description |
red |
amber |
green E |
If a placeholder is not unique, when the report is run, the first occurrence of the placeholder will show the appropriate system text, but subsequent occurrences will just show the placeholder name, such as:
As Sold
| Attribute | Red | Amber | green |
|---|---|---|---|
|
|
|
|
|
As Consumed
| orbcmReports.attr_2 | orbcmReports.red_2 | orbcmReports.amber_2 | orbcmReports.green_2 |
|---|---|---|---|
|
|
|
|
|
Note:
An alternative to using an incrementing numeric suffix as above, is to use a descriptive differentiator to form a unique placeholder, such as orbcmReports.asSoldRed and orbcmReports.asConsumedRed.
If the portal operates just a single language and there is no requirement for translations, the fixed text could simply be hard-coded, however the use of placeholders is recommended, as it allows for changes to system text, and the introduction of languages without the need to rebuild report templates.
The system text must be on its own line, and must not include any spaces, tabs, or other characters:
| Correct | Incorrect |
|---|---|
|
"orbcmReports.totalChargedCost" |
"orbcmReports.totalChargedCost " |
|
"orbcmReports.totalChargedCost : " |
|
|
orbcmReports.totalCost: 999,999.00 |
orbcmReports.totalCost: 999,999.00 |
|
orbcmReports.totalChargedCost: 999,999.00 RS |
orbcmReports.totalChargedCost: 999,999.00 RS |
If a new item of system text needs to be created to cater for a duplicate reference, the process described in Configuring System Text and XLIFF for Reports is used.
API Data Source XML Contents
In the XML returned from the APIs for Audit and Specifications, fields that can have language translations have their value returned in a localeData element, in the language of the user who scheduled the report.
Certain fields within the Product Specification allow text values to be entered both in the user's language and in the language of the data that will appear on pack. In this case, the data that has alternative pack copy language translations is contained in a packCopyLocaleData element.
Style Guidelines
This section describes the style standards used for the Brand Compliance core reports.
|
Header |
A single row containing the report title, inserted in the report header area. |
|
Background color: 245-245-245 |
|
|
Title: Albany WT, 18, centre, color: 32-32-32 |
|
|
Sub Heading |
Albany WT, 12, left, color: 32-32-32 |
|
Table |
Column Headings: Albany WT, 11 (or 9 if many columns), left (or center if spanned), text color: 80-80-80, background color: 245-245-245 |
|
Data Rows: Albany WT, 9 (or 8 if many columns), top/left, borders: inside only text color: 112-112-112, border color: 230-230-230 |
|
|
Count/Totals |
Label: Albany WT, 11, left, color: 32-32-32 |
|
Value: Albany WT, 9, left, color: 112-112-112 |
|
|
Chart |
Heading: Albany WT, 11, left, color: 80-80-80, background color: 245-245-245 |
|
Body |
Field Label: Albany WT 11, left, color: 80-80-80 |
|
Field: Albany WT 9, left, color: 112-112-112 |
|
|
Table Heading: Albany WT, 11, bold, left, color: 32-32-32 |
|
|
Table Column Headings: per Table |
|
|
Table Data Rows: per Table |
|
|
Section Heading: per Sub Heading |
|
|
Fixed Text Table: per Table, but vertical |
|
|
Footer |
A single row, inserted in the report footer area. |
|
Background color: 245-245-245 |
|
|
Date & Time: Current date and time: Albany WT, 7, left, format: DD/MM/YYYY HH:MM update automatically, color: 112-112-112 |
|
|
Report Ref: Albany WT, 7, color: 112-112-112 The core reports use a CR (core report report) prefix |
|
|
Page Number: Page number: Albany WT, 7, right, format: X / Y, color: 112-112-112 |