18 Retail DB Ops Console
Customers are responsible for both tuning their extensions and monitoring their CPU and storage capacity utilization. The Retail DB Ops Console provides customers the tools necessary to fulfill this responsibility. Additional capabilities provided in various Oracle DB packages can provide more detailed metrics and statistics. Consult Oracle documentation for further information.
Home
The Retail DB Ops Console can be accessed from Retail Home’s Application Navigator. The home page can be accessed by a ‘Viewer’ having RDS_MANAGEMENT_VIEWER or RDS_MANAGEMENT_VIEWER_PREPROD roles.
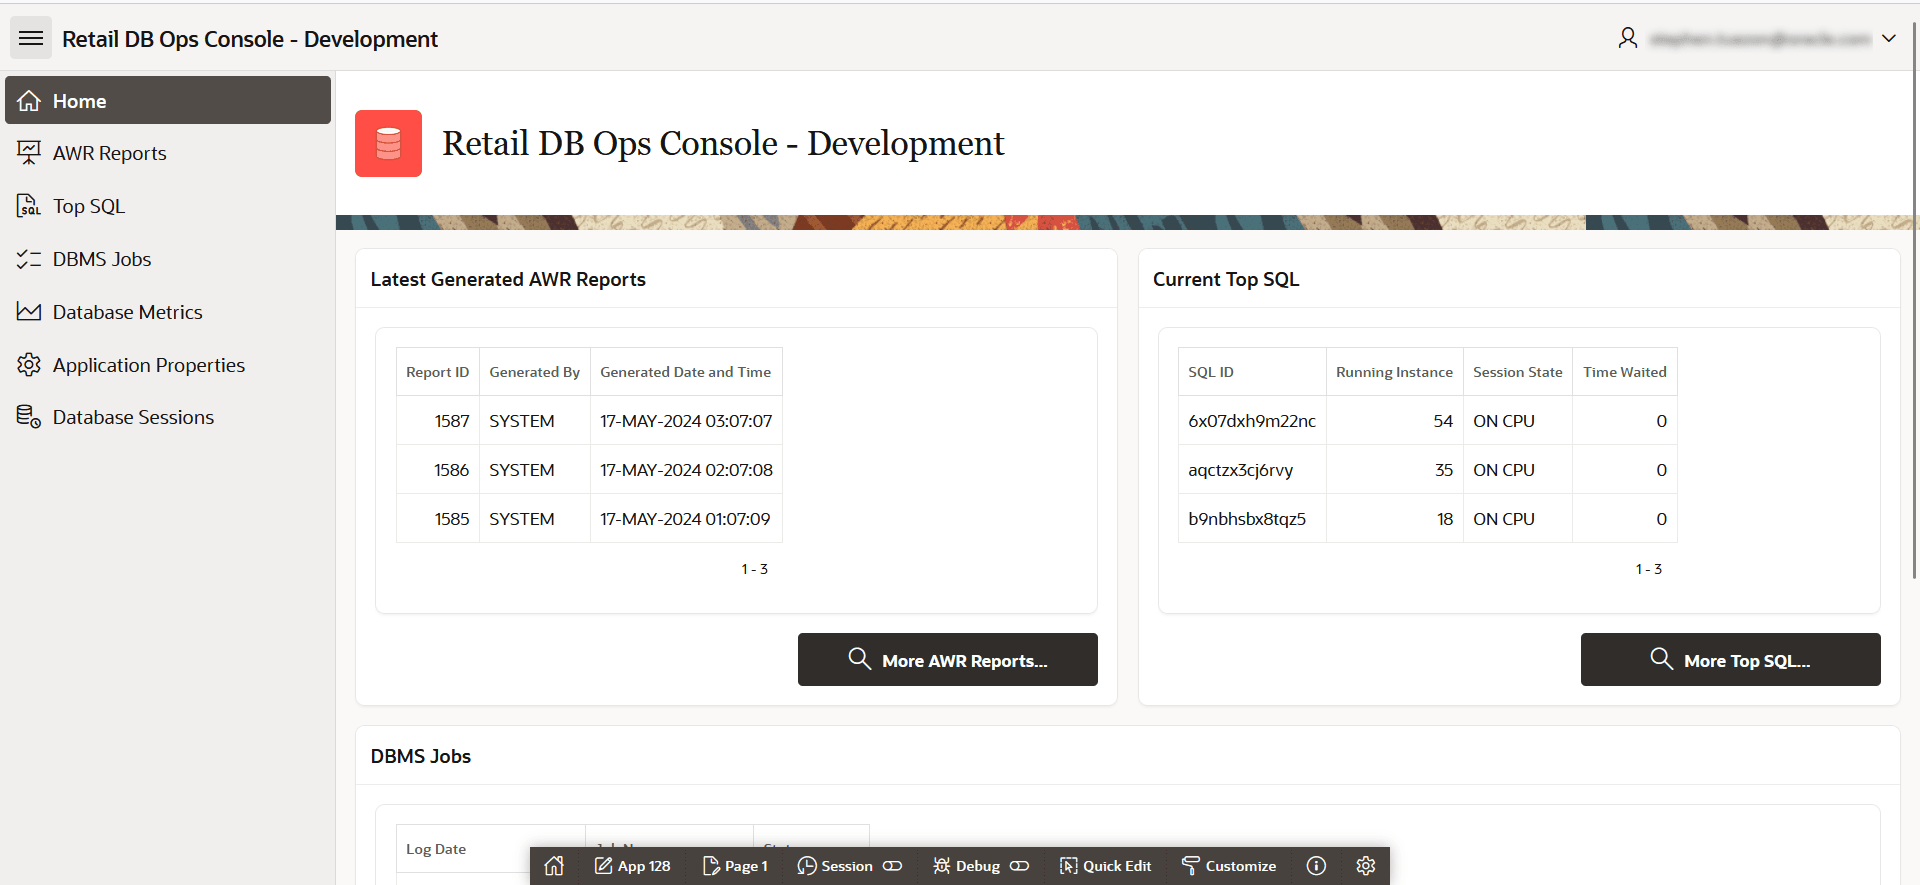
The Home page gives a quick view of recent data for the following:
-
Latest Generated AWR Reports.
-
Current Top SQL
-
DBMS Jobs
Figure 18-1 DB Ops Console
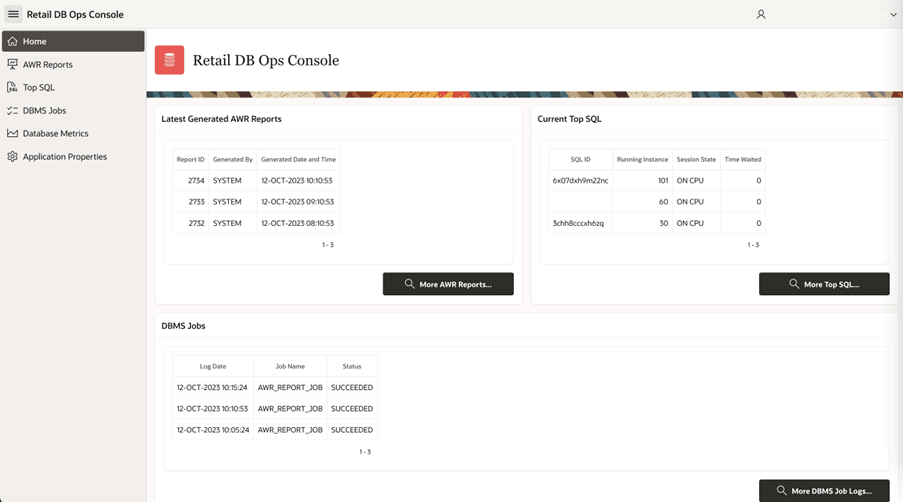
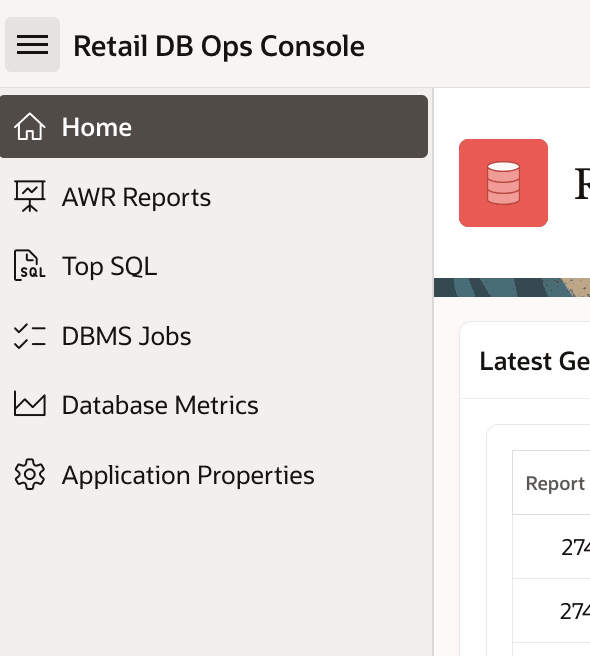
All features can be accessed from the left panel.
Figure 18-2 DB Ops Console Menu
AWR Reports
The AWR stands for Automated Workload Repository Report and provides a set of tables into which snapshots of system statistics are stored. Generally, these snapshots are taken on an hourly basis and include wait interface statistics, top SQL, memory, and I/O information that is cumulative in nature up to the time of the capture.
The AWR report process takes the cumulative data from two snapshots and subtracts the earlier snapshot’s cumulative data from the later snapshot and then generates a delta report showing the statistics and information relevant for the time period requested.
Search Generated AWR Reports
Search Generated AWR Reports screen can be accessed by a ‘Viewer’ having RDS_MANAGEMENT_VIEWER or RDS_MANAGEMENT_VIEWER_PREPROD roles and shows a list of generated reports and allows the user to filter the reports based on the following:
-
Snap ID – The unique key of a snapshot
-
Generated By – System or User
-
Interval by Date and Hour
Figure 18-3 AWR Reports
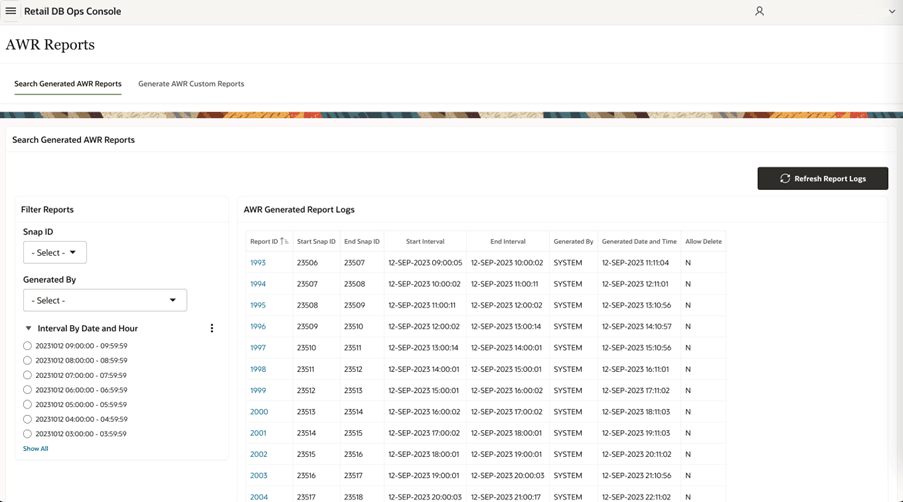
The list of generated report logs is provided in the “AWR Generated Report Logs” table that contains the following information for every Report ID. The ‘Refresh Report Logs’ button can be used to refresh the table to display the newly generated reports.
-
Report ID: Unique ID of the generated report.
-
Start Snap ID: Snap ID of the start snapshot in that time interval.
-
End Snap ID: Snap ID of the end snapshot in that time interval.
-
Start Interval: Start timestamp of the snapshot interval.
-
End Interval: End timestamp of the snapshot interval.
-
Generated By: If generated automatically by the system, then SYSTEM is populated. If generated manually by any user, then that user’s ID is populated.
-
Generated Date and Time: Timestamp of the report generation.
-
Allow Delete: Indicator that mentions if the report can be deleted or not.
Generated reports are retained for 30 days.
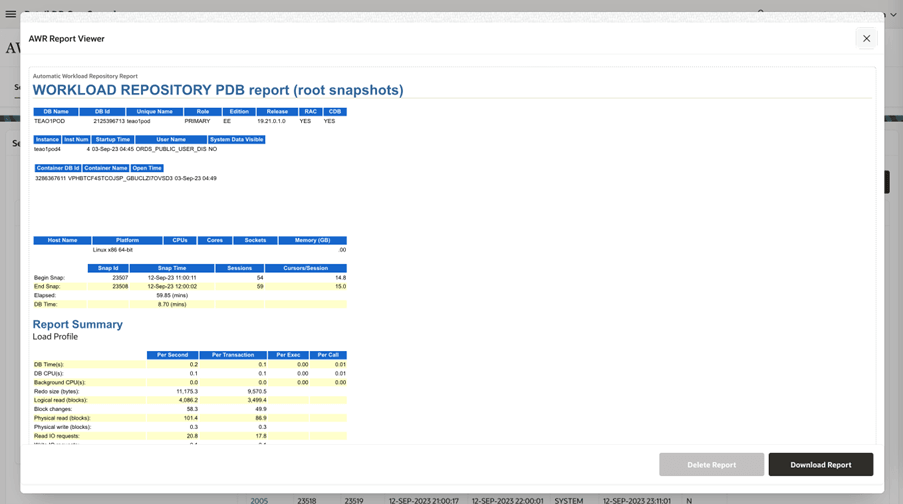
AWR Report Viewer
When clicking on the Report ID, a detailed AWR Report is displayed. The report can be downloaded or deleted from this window.
Figure 18-4 AWR Report Viewer
Generate AWR Custom Reports
This screen enables an ‘Owner’ having RDS_MANAGEMENT_OWNER or RDS_MANAGEMENT_OWNER_PREPROD roles to generate reports based on Interval Start Date and Time and Interval by Number of Hours. Custom reports are retained for 30 days and then purged.
Figure 18-5 AWR Reports Generation

Top SQL
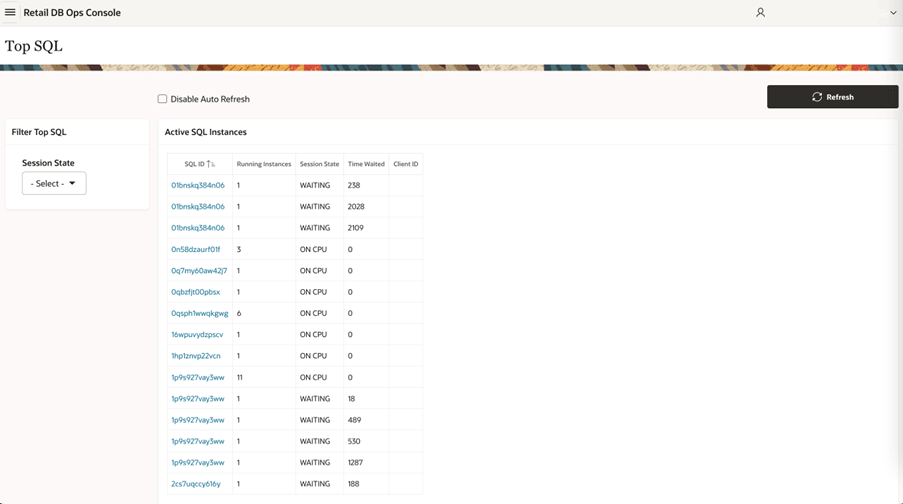
Top SQL screen displays a list of active SQL instances and their details that the snap process collects from SQL statements. The instances also can be filtered based on the Session States – ON CPU and WAITING. This page can be accessed by a ‘Viewer’ having RDS_MANAGEMENT_VIEWER or RDS_MANAGEMENT_VIEWER_PREPROD roles.
Figure 18-6 Top SQL
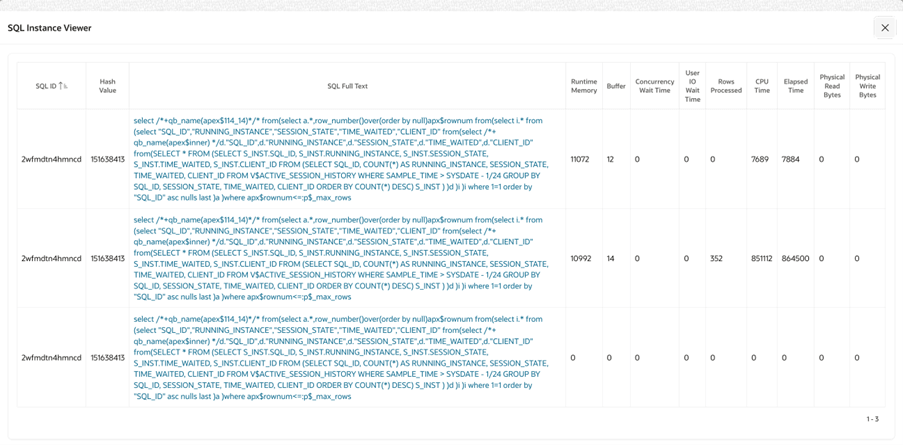
Clicking on the SQL ID link opens up a window with more details on the SQL Instance.
Figure 18-7 SQL Instance Viewer
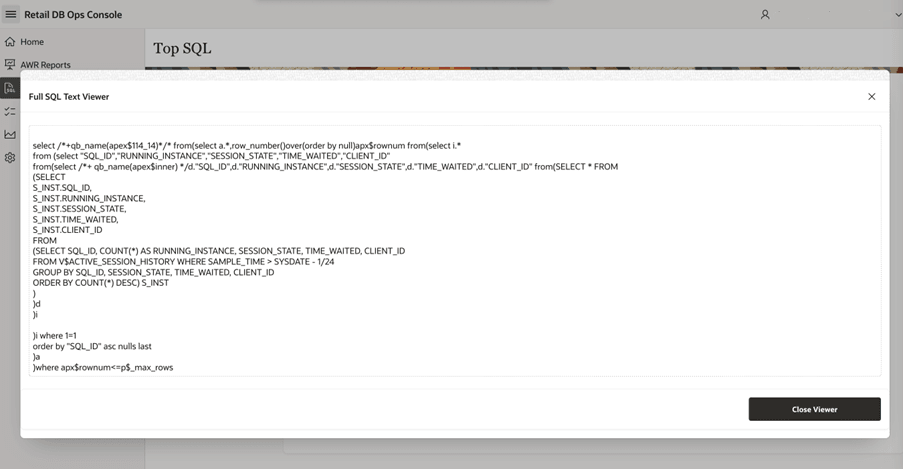
Clicking on the SQL Full Text link shows the complete SQL statement.
Figure 18-8 SQL Text Viewer
DBMS Jobs
The DBMS Jobs table lists the available DB jobs and their details. This page can be accessed by a ‘Viewer’ having RDS_MANAGEMENT_VIEWER or RDS_MANAGEMENT_VIEWER_PREPROD roles.
Figure 18-9 DBMS Jobs
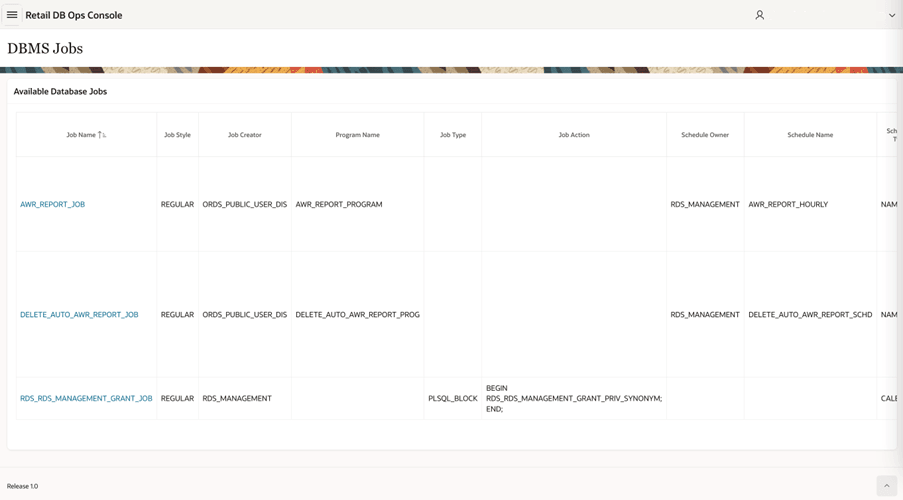
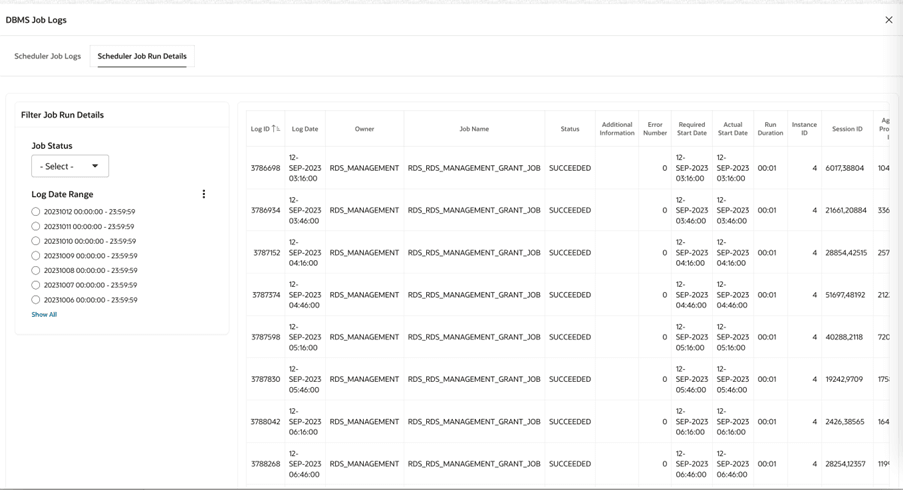
Clicking on the Job Name opens a window with detailed job log and job run details. For example, the job log and job run details for ‘RDS_RDS_MANAGEMENT_GRANT_JOB’ is as shown below.
Figure 18-10 DBMS Scheduler Job Logs

Figure 18-11 DBMS Scheduler Job Run Details
Database Metrics
A database metrics page can be accessed by an ‘Administrator’ (i.e., someone having RDS_MANAGEMENT_ADMINISTRATOR or RDS_MANAGEMENT_ADMINISTRATOR_PREPROD roles). These metrics describe different aspects of database load. The following table lists the eight database metrics viewable for this environment’s Oracle APEX and database instance.
| Metric | Description |
|---|---|
|
CPU Utilization |
The percentage of processing capacity currently used by active processes |
|
Storage Utilization |
The percentage of subscription capacity currently allocated. See the note on storage utilization below. |
|
Session Count |
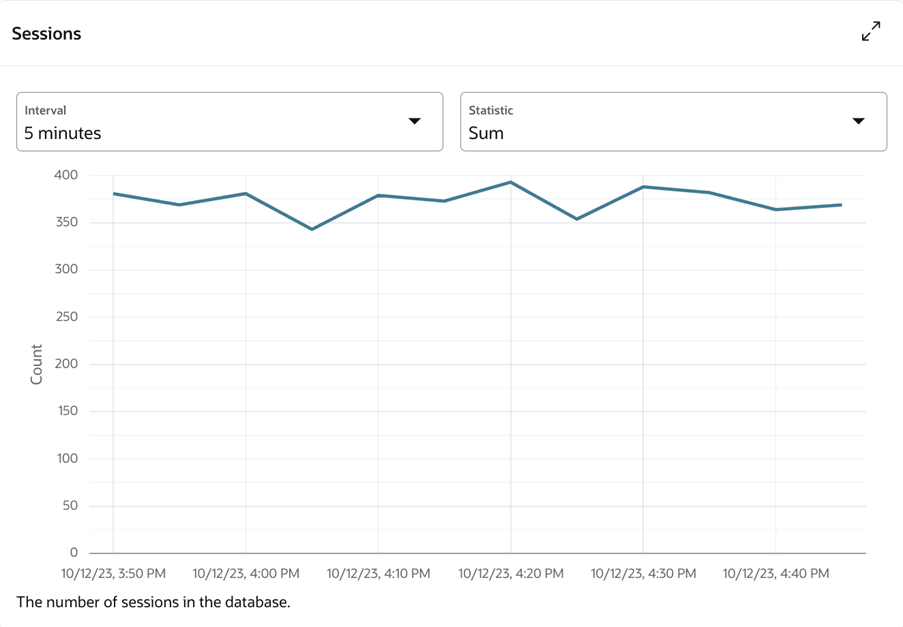
A logical entity in the database instance memory that represents the state of a current user log in to a database. The metric reflects the level of concurrent activity being handled by the database. |
|
Execute Count |
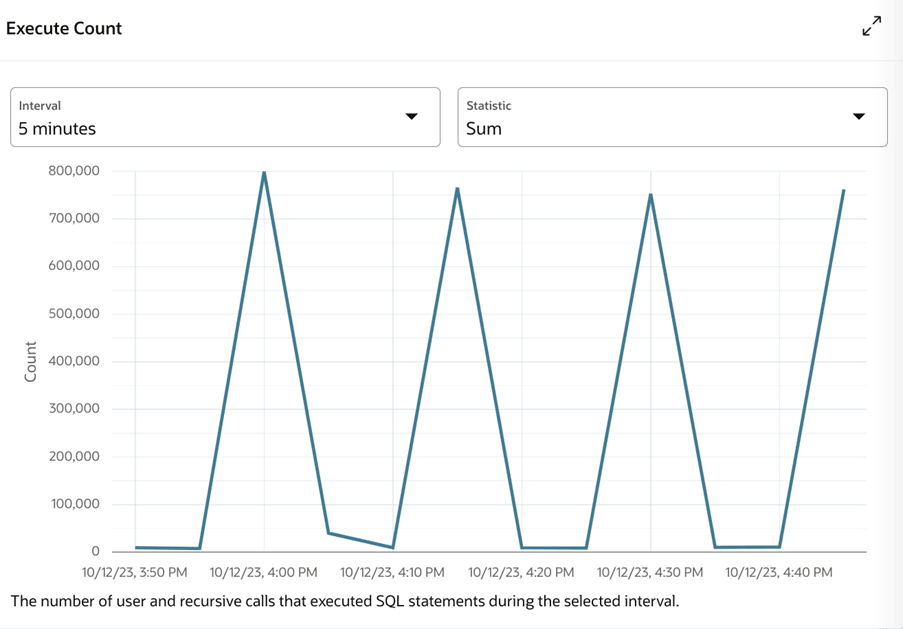
The number of SQL statements executed. The metric provides a measure of workload by indicating how many SQL statements have been run during a specific period. |
|
Running Statements |
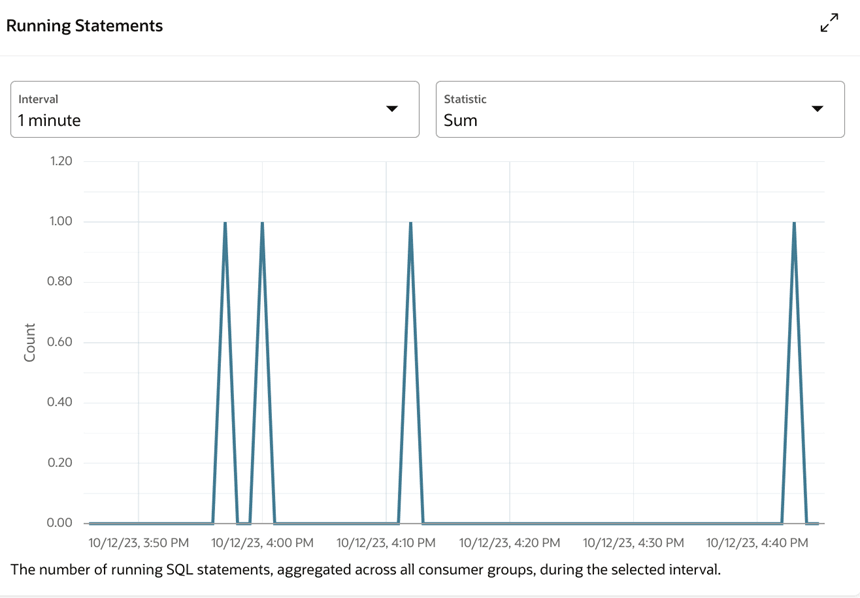
The number of SQL statements currently being executed by the database. The metric indicates the number of active processing tasks that are consuming resources. |
|
Queued Statements |
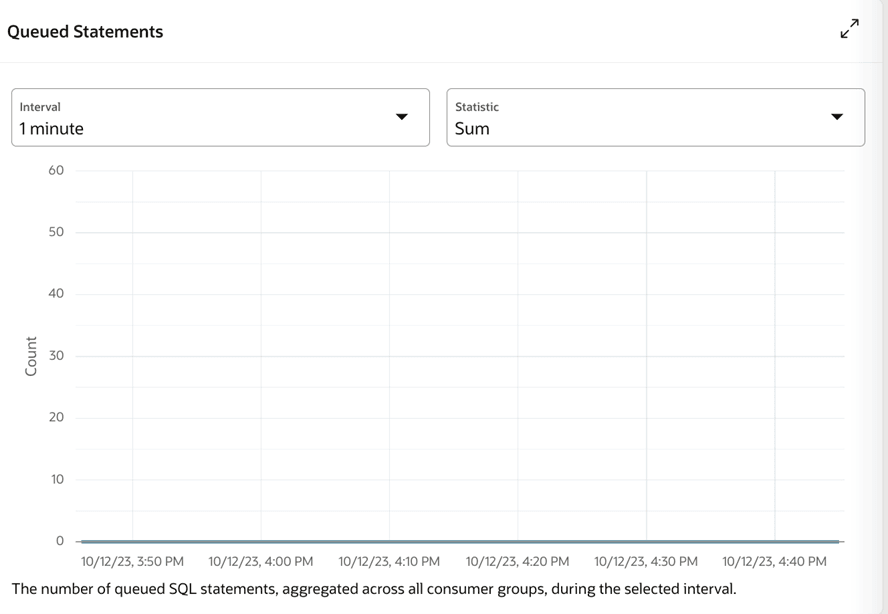
The number of statements that are waiting to be executed, typically due to resource contention or scheduling within the database. This metric indicates the quantity of work that is in the backlog. |
|
APEX Load Time |
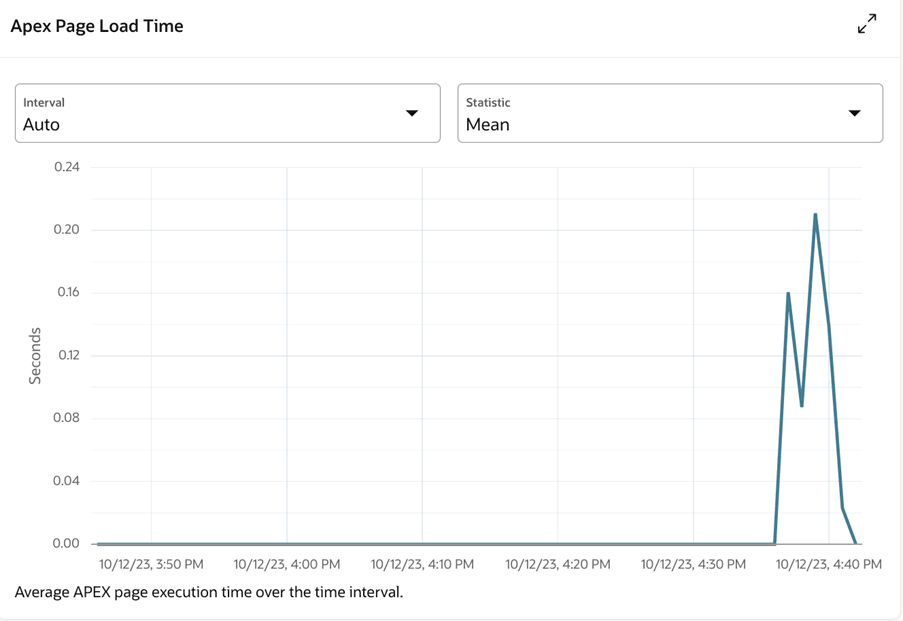
The time it takes for an APEX page or application to load and render in the user’s browser. This metric can be used to assess the overall usability of your APEX applications from a perceived performance point of view. |
|
APEX Page Event |
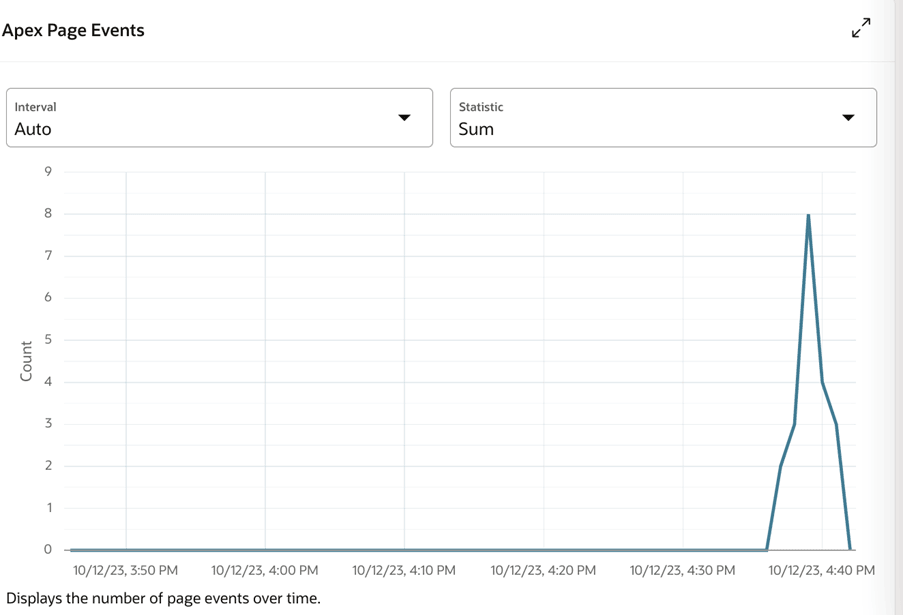
A count of the APEX page loads, submissions, or processes. This metric indicates the user activity intensity. |
Note:
Storage utilization in both the DB Ops Console and Retail Home report subscription usage. This usage represents high water mark metrics (and in the case of Retail Home, it's the high water mark per month). A more detailed view of storage consumption can be obtained using the following query in the SQL Commands page of the SQL Workshop in the APEX UI.
select owner, cast(sum(bytes) / power(1024,2) as integer) MB from dba_segments where owner like '%_RDS%' group by owner order by ownerYou can view a number of descriptive statistics over a variety of time intervals. The available statistics are as follows
| Statistic | Description |
|---|---|
|
Count |
Returns the number of observations received in the specified interval. |
|
Max |
Returns the highest value observed during the specified interval. |
|
Mean |
Returns the value of Sum divided by Count during the specified interval. |
|
Min |
Returns the lowest value observed during the specified interval. |
|
P50 |
Returns the estimated value of the 50th percentile during the specified interval. |
|
P90 |
Returns the estimated value of the 90th percentile during the specified interval. |
|
P95 |
Returns the estimated value of the 95th percentile during the specified interval. |
|
P99 |
Returns the estimated value of the 99th percentile during the specified interval. |
|
Rate |
Returns the per-interval average rate of change. The unit is per-second. |
|
Sum |
Returns all values added together, per interval. |
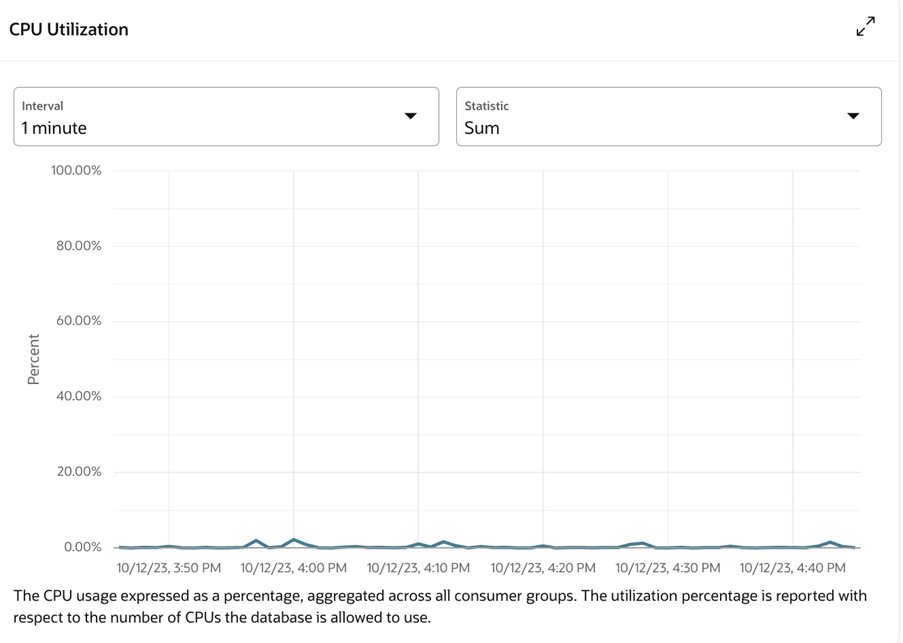
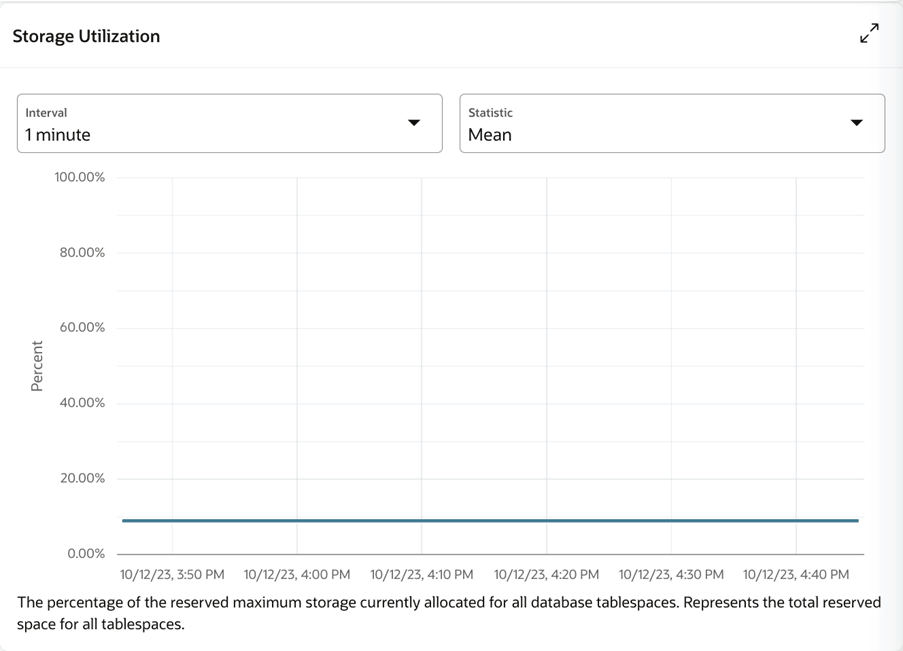
Example screenshots of each metric page are provided in the figures below.
CPU Utilization
Figure 18-12 CPU Utilization
Storage Utilization
Figure 18-13 Storage Utilization
Sessions
Figure 18-14 Sessions
Execute Count
Figure 18-15 Execute Count
Running Statements
Figure 18-16 Running Statements
Queued Statements
Figure 18-17 Queued Statements
APEX Page Load Time
Figure 18-18 APEX Page Load Time
APEX Page Events
Figure 18-19 APEX Page Events
Application Properties
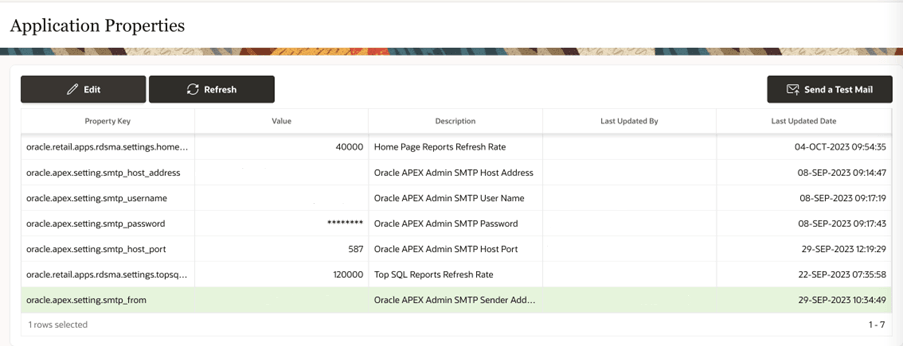
The Application Properties page lists the available application properties including Oracle APEX SMTP settings. The Application Properties are stored as key-value pair, e.g., oracle.apex.setting.smtp_from: me@email.com. This page can be accessed by an ‘Administrator’ having RDS_MANAGEMENT_ADMINISTRATOR or RDS_MANAGEMENT_ADMINISTRATOR_PREPROD roles.
Note:
Roles are synonymous with OCI groups. An assignment to an OCI group may take up to 1 hour to propagate.
Figure 18-20 Application Properties
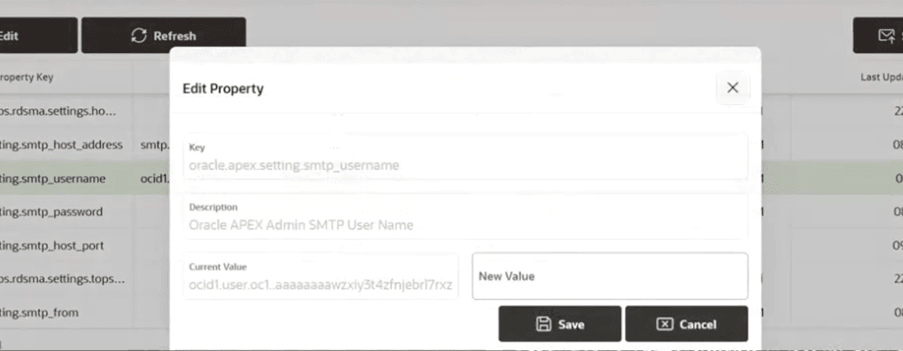
The value for the key can be updated using the Edit window.
Figure 18-21 Edit Property
Session Management
Session management provides a mechanism for managing custom database sessions interactively. The
session management UI allows the user to list and terminate database sessions based on
predefined criteria – that is, sessions that are nominally (but not guaranteed to be)
safe to terminate. Specifically, sessions where the username is
ORDS_PUBLIC_USER_DIS and the schemaname is NULL, or where the
username or schemaname contains the substring _RDS_CUSTOM. These
criteria are formulated to minimize the risk of terminating essential, non-custom
sessions. These criteria may, nonetheless, identify essential custom sessions as
candidates for termination. Thus, it remains the responsibility of the user to ensure
that the termination of a session will yield the desired outcome. It is possible that
you may wish to terminate additional sessions that do not fit the above criteria. If so,
submit a support request to terminate one or more sessions that are beyond the scope of
the session management UI. Note that, even when terminating one or more sessions through
a support request, you are responsible for the consequences of termination.
Refer to the “Post Installation Configuration” chapter of the Retail Data Store Security Guide for details on the OCI groups needed to unlock Session Management capabilities.
-
To start managing sessions, tap the Database Sessions button in the navigation side bar (see Figure 18-22). Database sessions will open on the right side of the parent panel (see Figure 18-23). Session Management enables the user to:
-
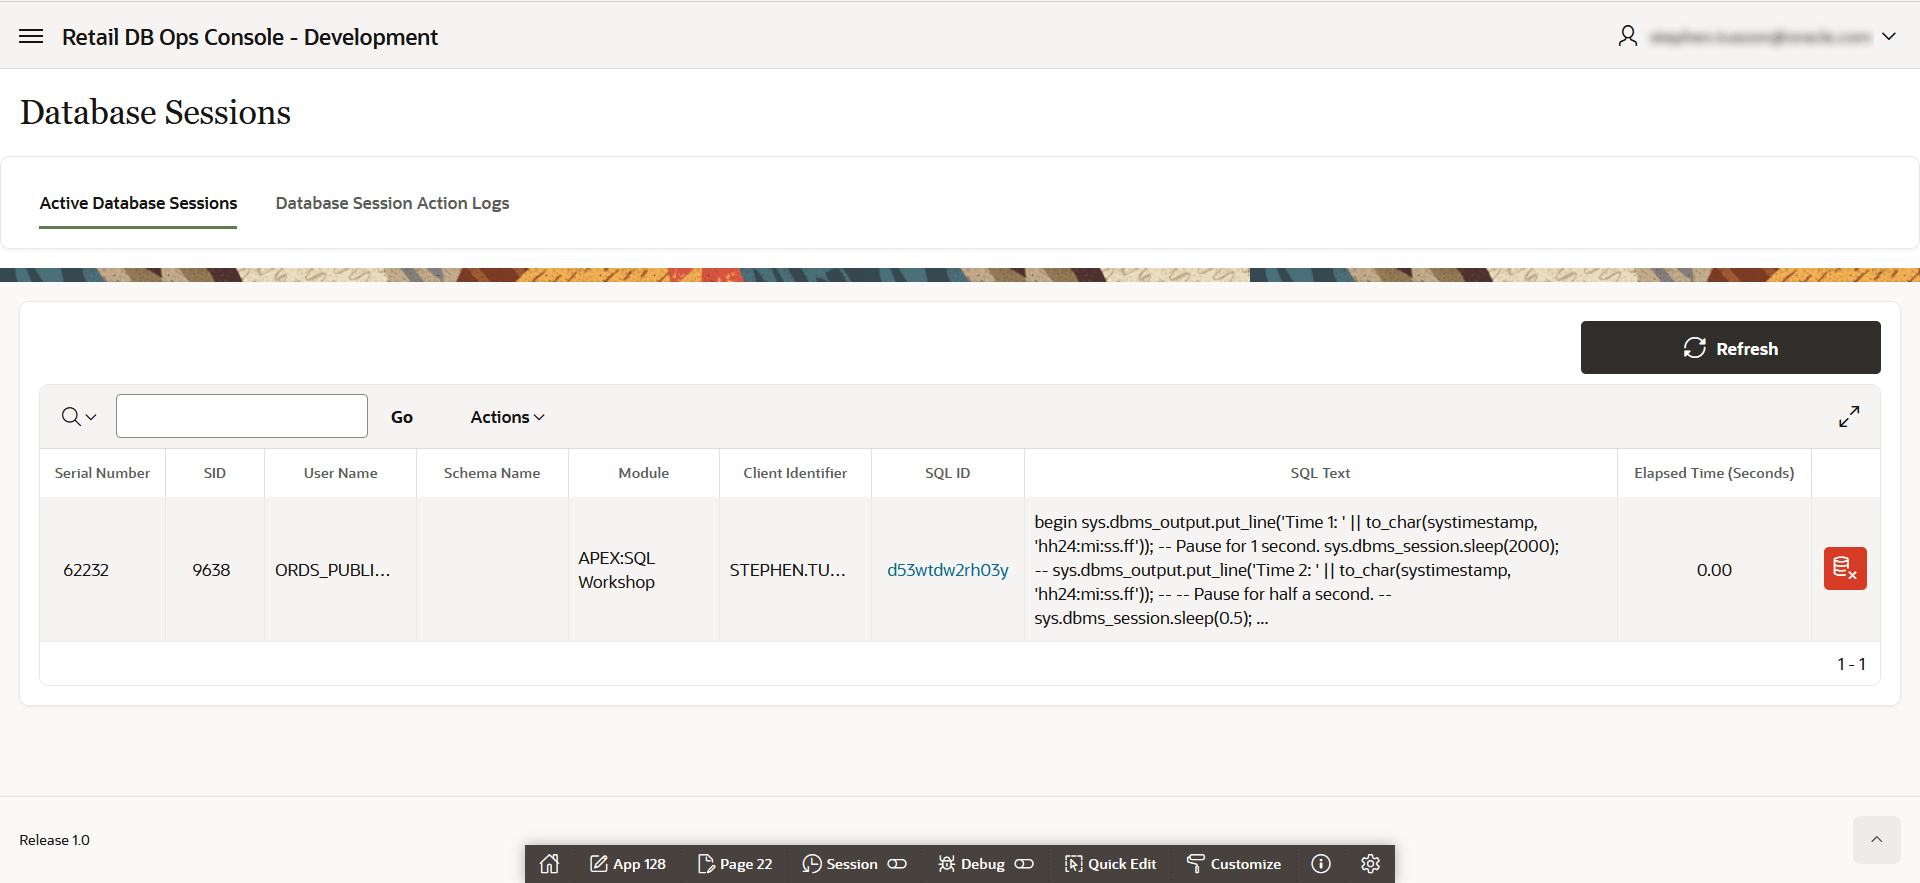
View a list of running database sessions (see Figure 18-24)
-
End a running database session from the list by clicking end Database Session button:
-
enabled/visible for users with the
RDS_MANAGEMENT_ADMINISTRATORrole -
available on each row at the last column of the interactive report
-
-
Perform a “Refresh on Demand” with the Refresh Button of the Active Database Sessions
-
disabled/not visible for users without administrator role
-
Figure 18-23 Database Sessions Page
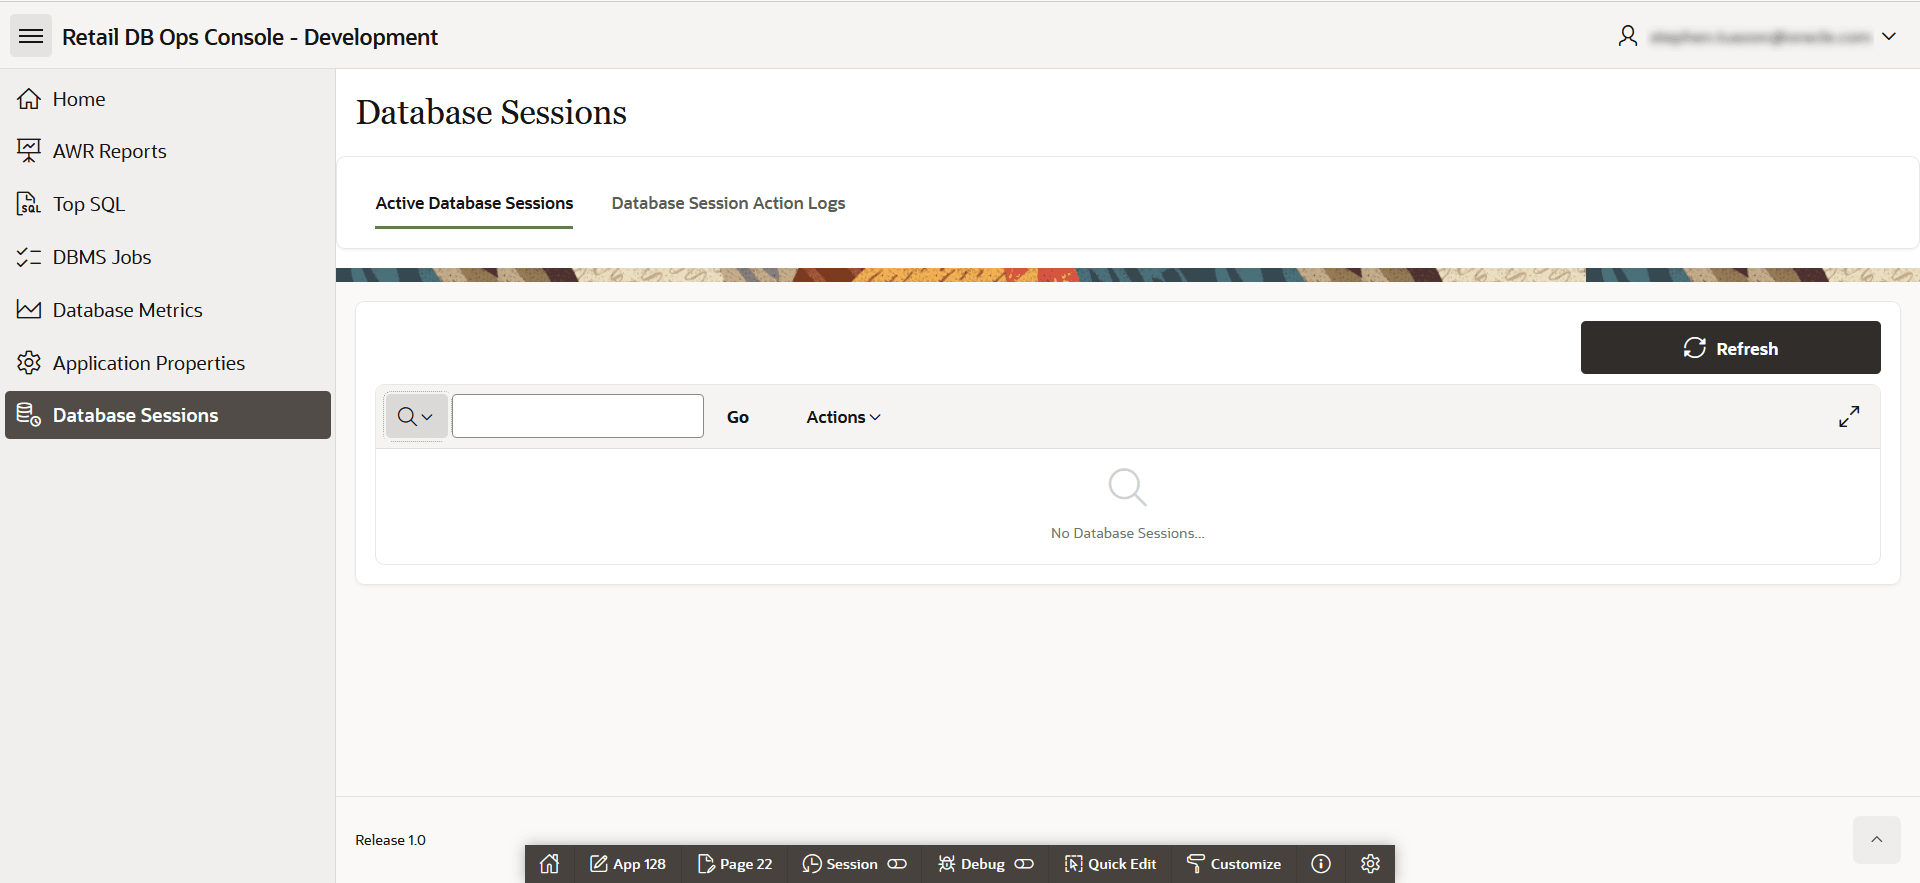
Figure 18-24 Active Sessions
-
-
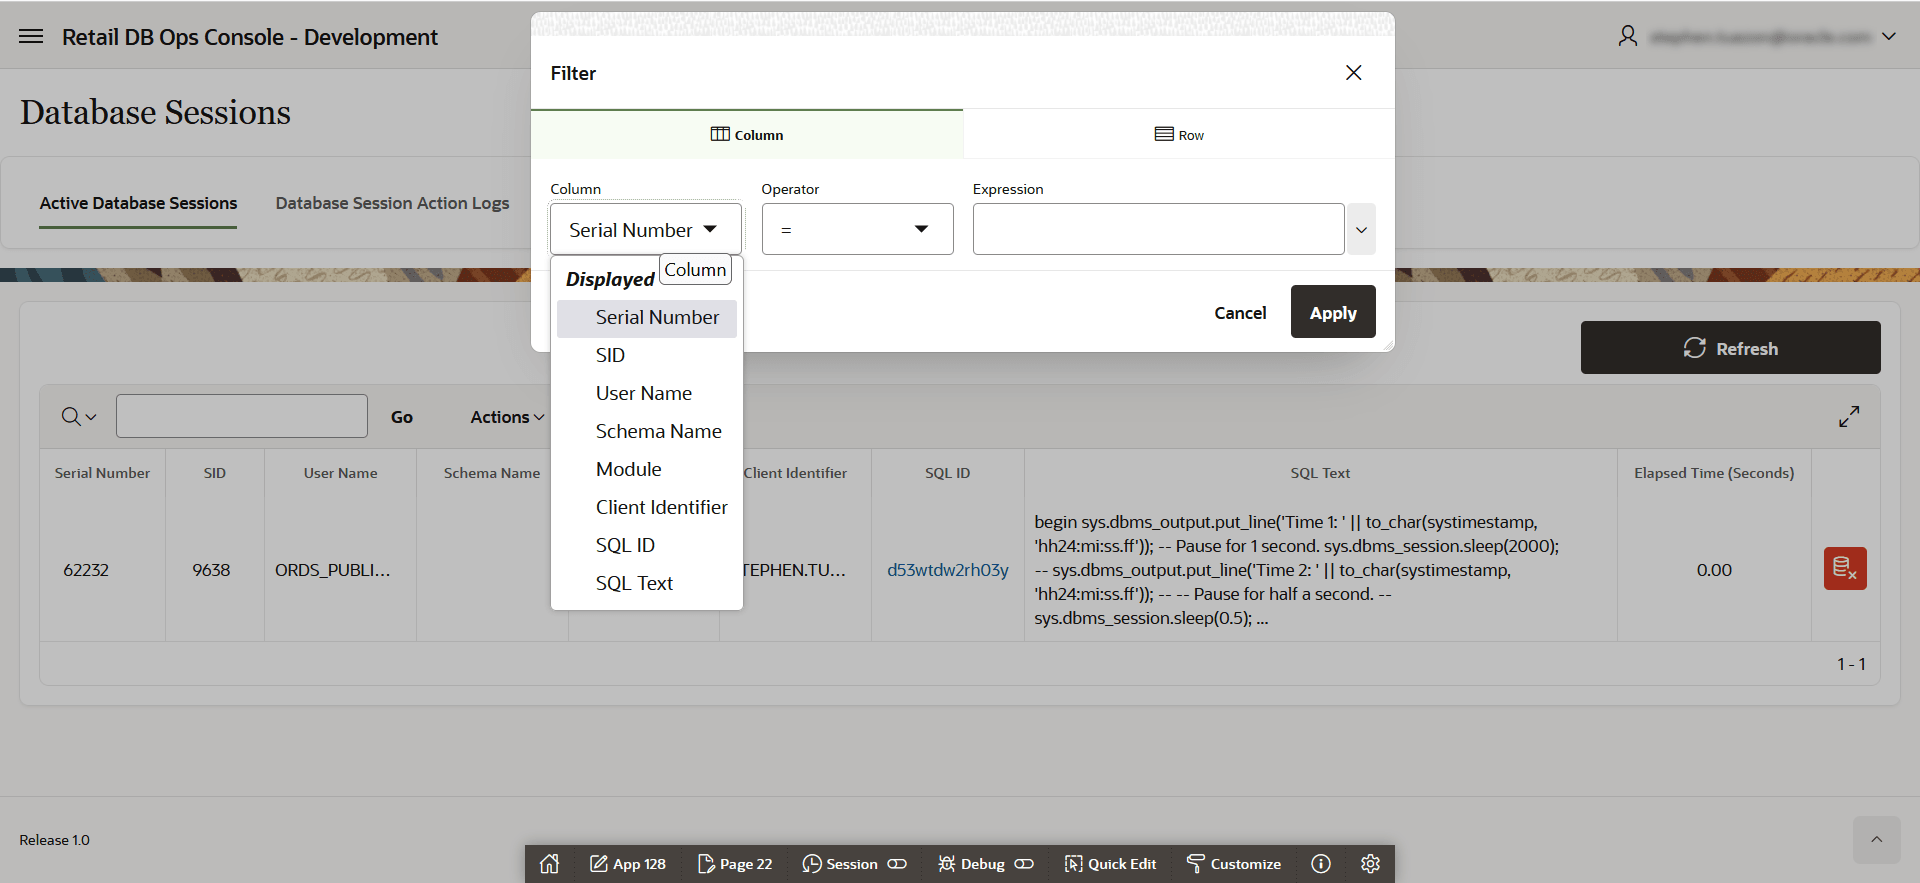
Use the filter functionality under the Actions Menu on the interactive report to filter the results presented on the page (see Figure 18-25 and Figure 18-26). Available filters are: Serial Number, SID, User Name, Schema Name, Module, Client Identifier, SQL ID and SQL Text.
Figure 18-25 Filtering
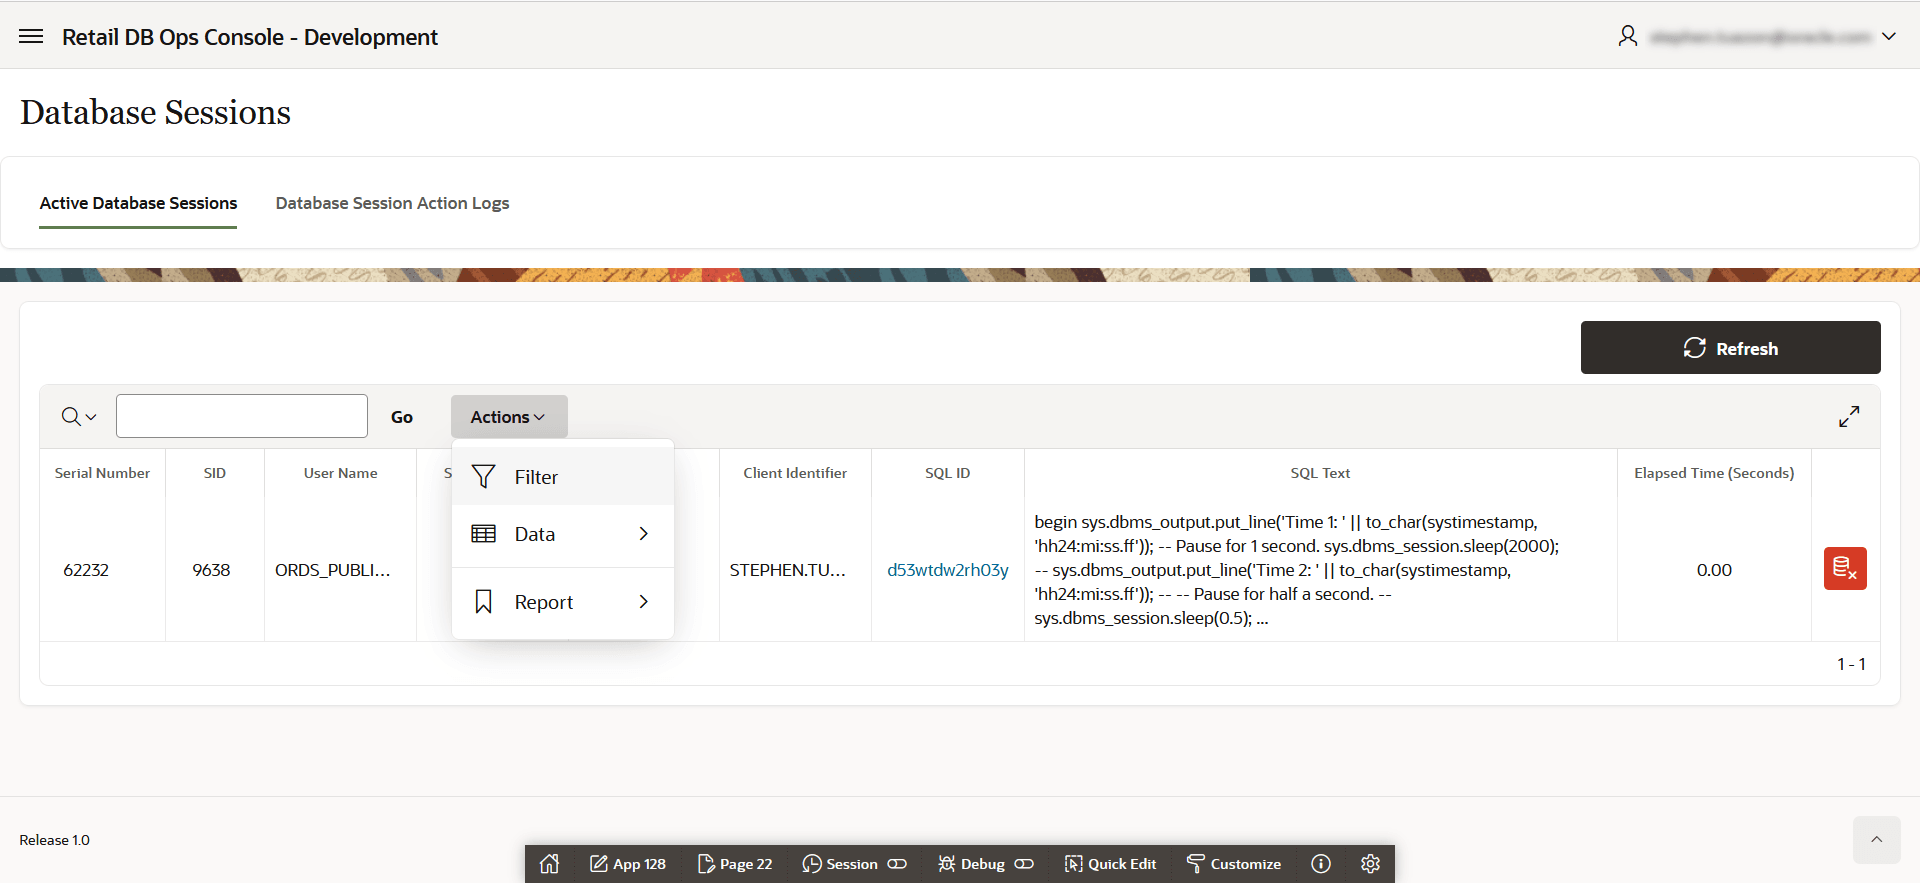
Figure 18-26 Filtering Example
-
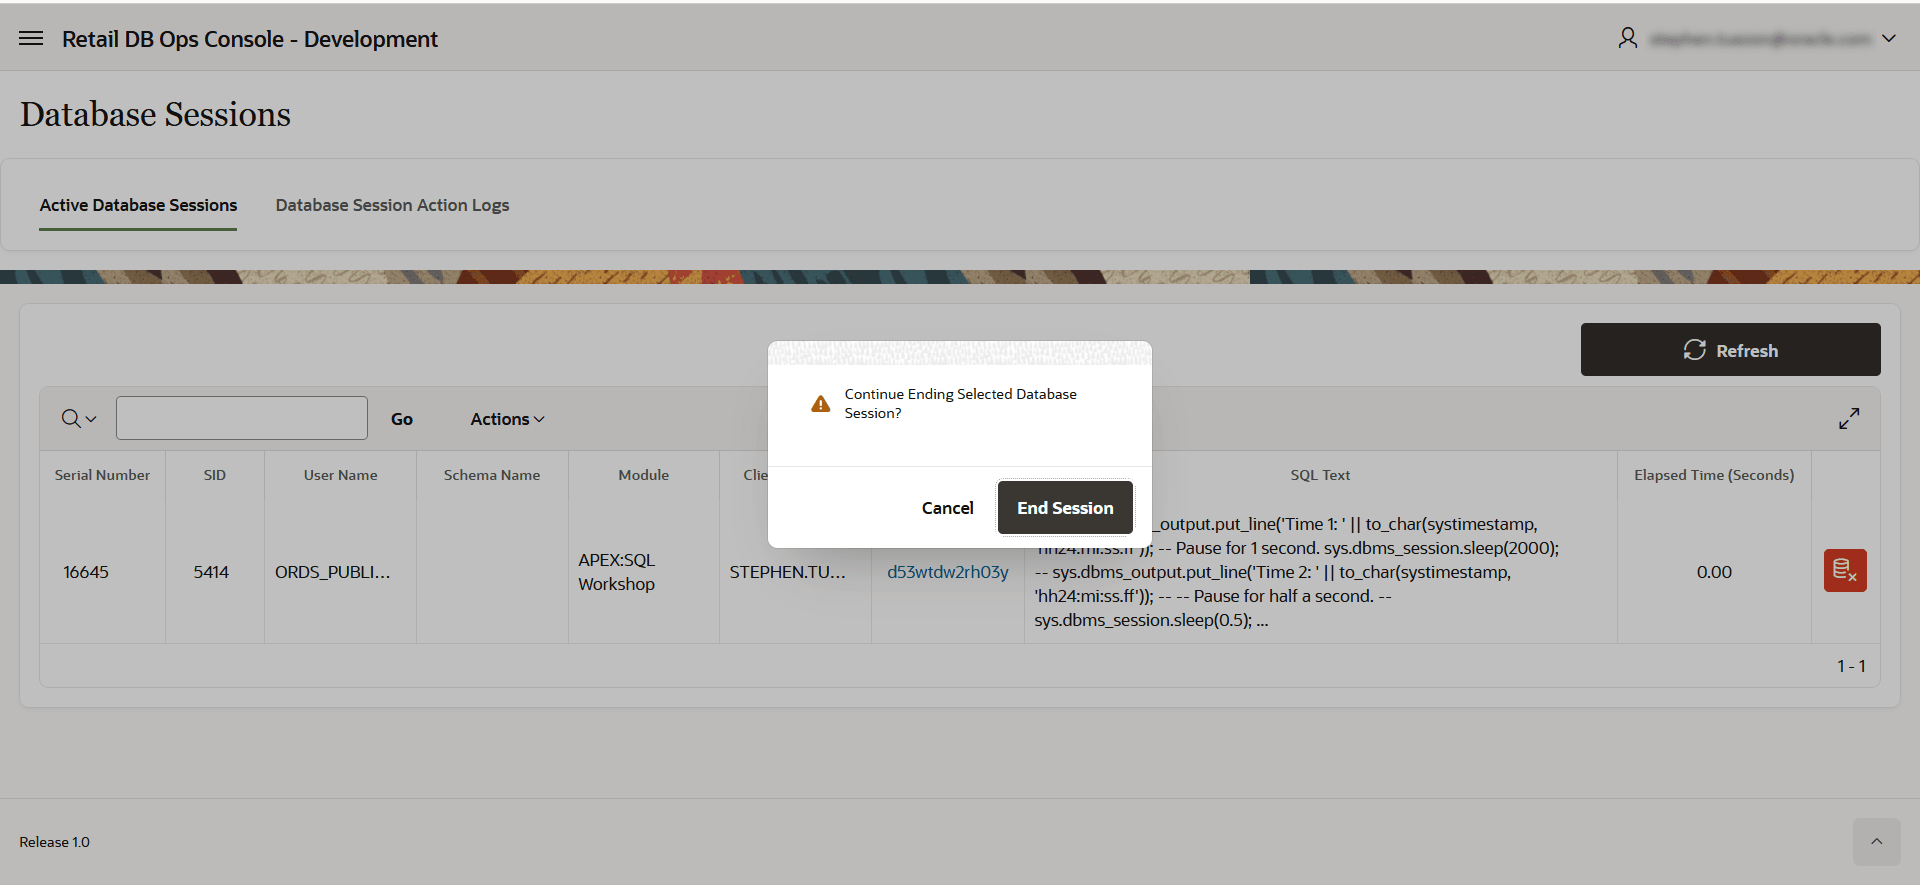
To end a database session, tap the End Database Session button (see Figure 18-27) in the list of database sessions (in the last column of the row). Then tap the End Session button (or tap Cancel) on the pop-up dialog (see Figure 18-28). This will end the database session and reload the Active Database Sessions Interactive Report. The ended session is removed from the list of Active Database Sessions in the Interactive Report when reloaded.
Figure 18-27 End Database Session
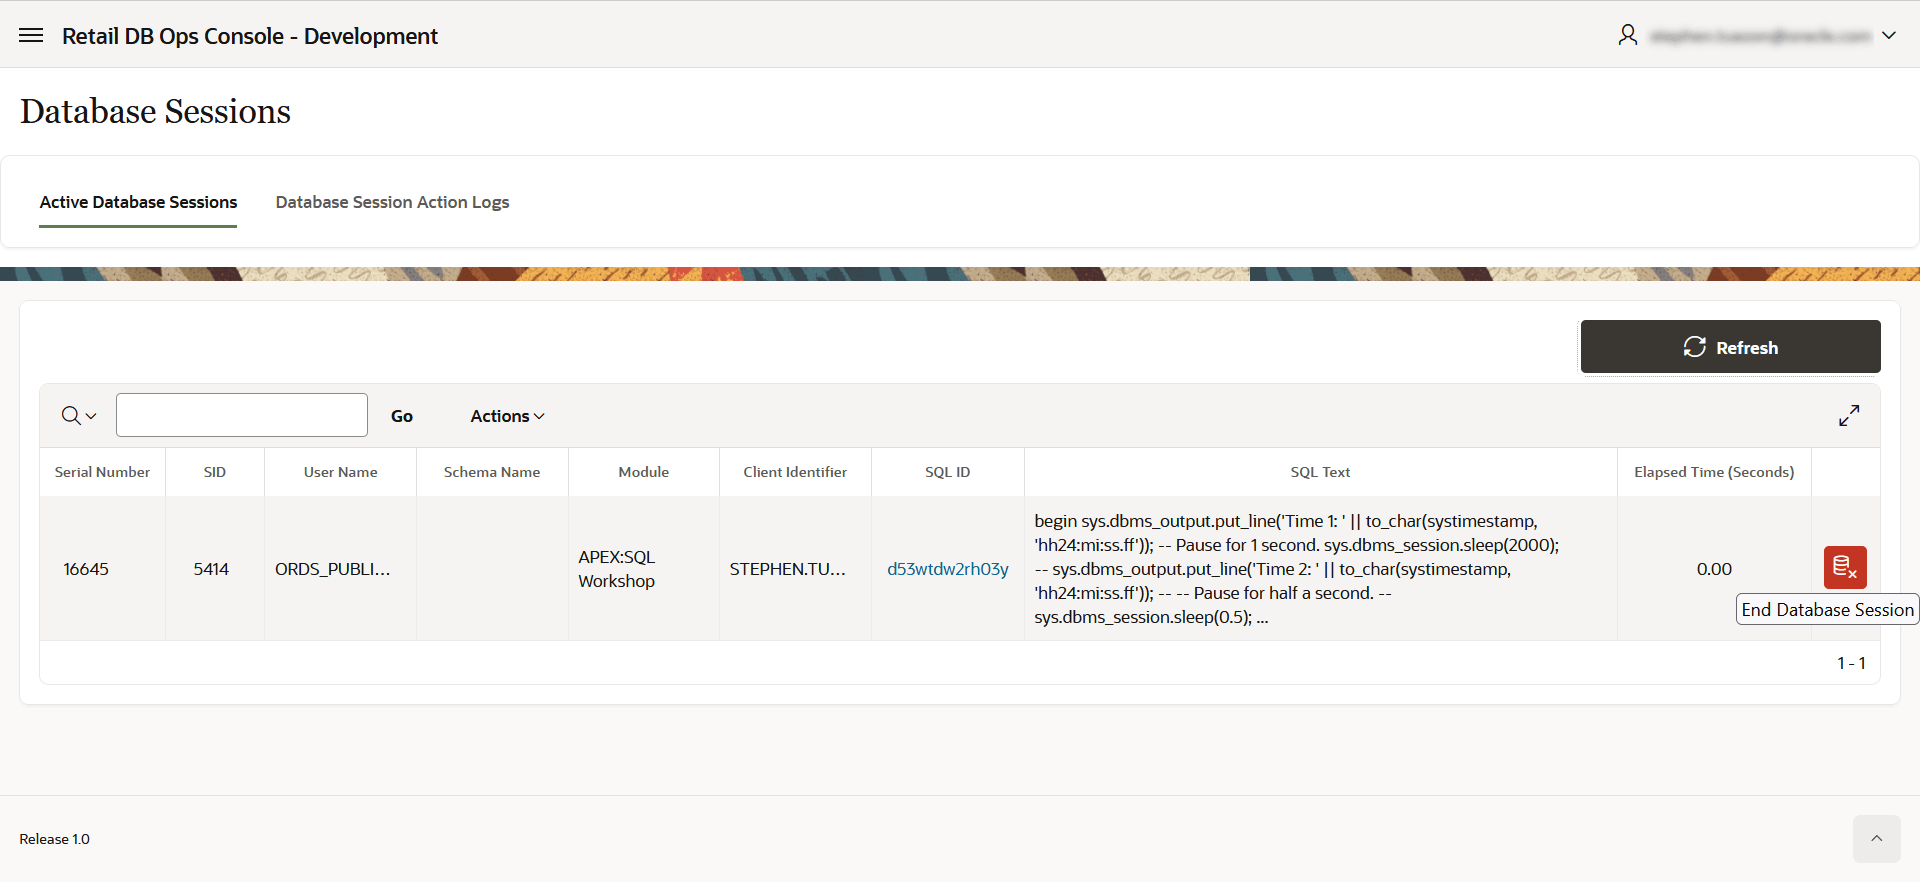
Figure 18-28 End Database Session Pop-Up
-
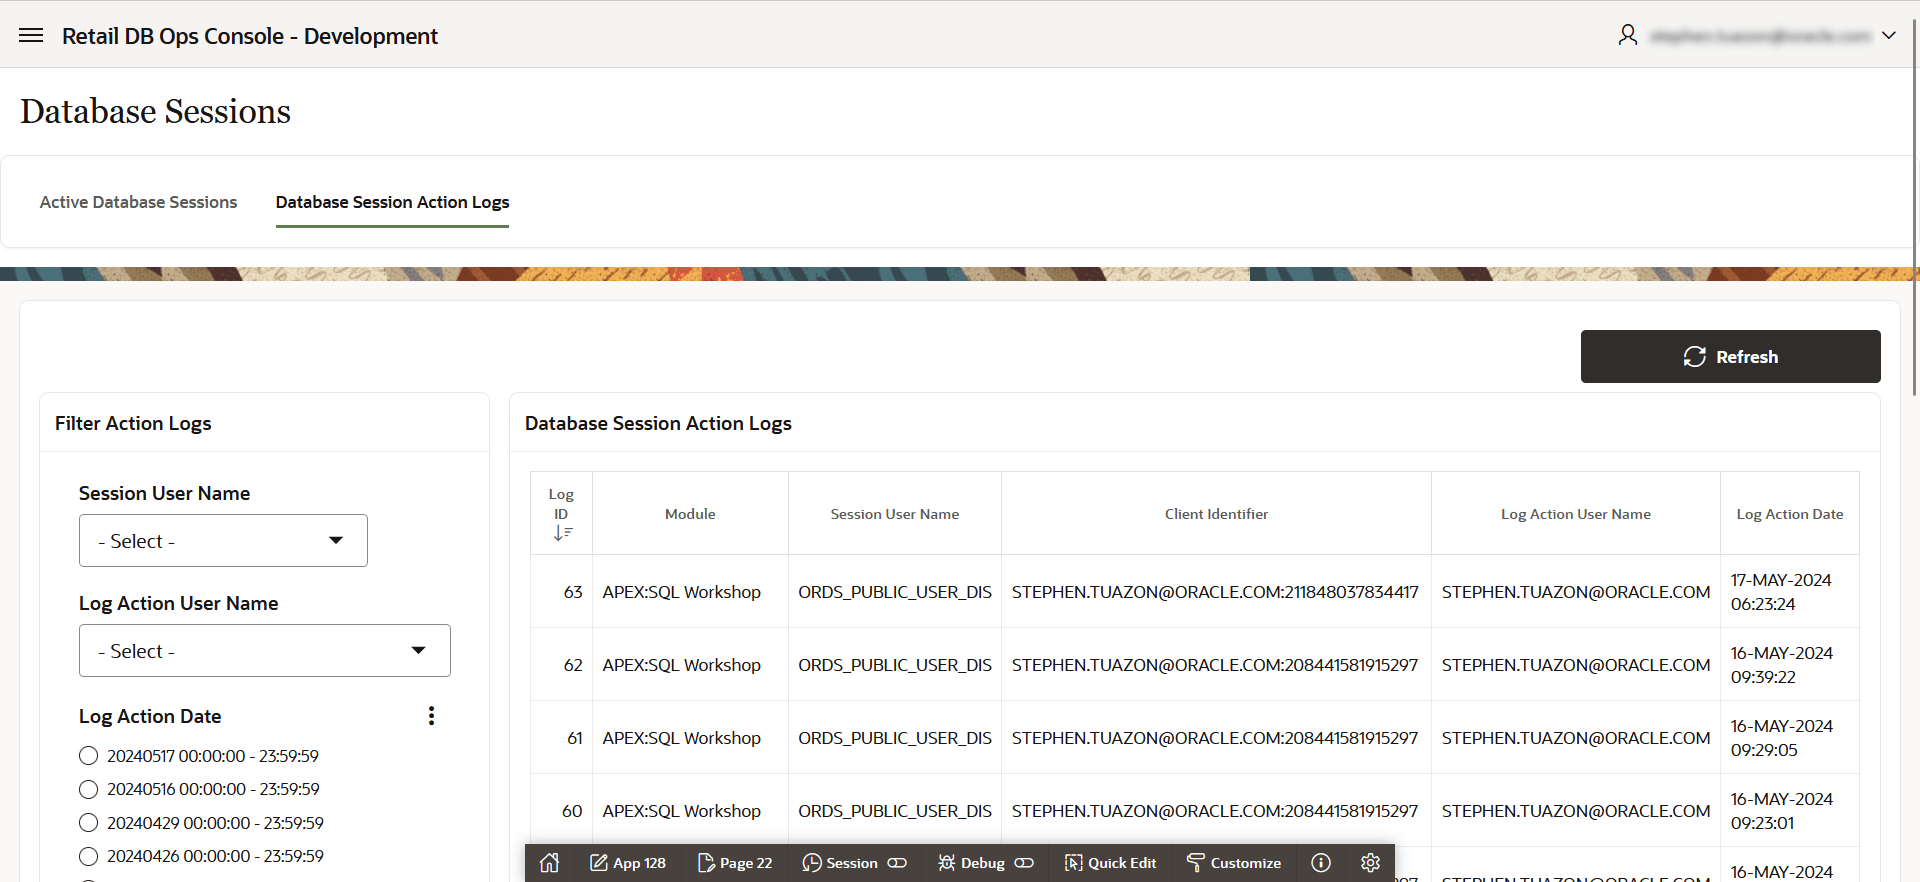
The Database Session Action Logs (see Figure 18-29) enables a user with the administrator role to:
-
View the logs with details of ended sessions
-
Refresh the action log with the Refresh Button
-
Filter logs using Session User Name, Log Action User Name, and Log Action Date.
Figure 18-29 Action Logs
-
Session Management API
RDS also provides a session management API for managing custom database sessions programmatically. Programmatic termination of sessions may be called for when the number of sessions that need to be terminated would make interactive termination burdensome.
This API consists of a package containing procedures and functions to list and terminate database sessions based on predefined
criteria – that is, sessions that are nominally (but not guaranteed to be ) safe to terminate. Specifically, sessions where
the username is ORDS_PUBLIC_USER_DIS and the schemaname is NULL, or where the username or schemaname contains
the substring _RDS_CUSTOM. These criteria are formulated to minimize the risk of terminating essential, non-custom
sessions. These criteria may, nonetheless, identify essential custom sessions as candidates for termination. Thus, it remains
the responsibility of the API user to ensure that the termination of a session will yield the desired outcome.
It is possible that you may wish to terminate additional sessions that do not fit the above criteria. If so, submit a Support Request to terminate one or more sessions that are beyond the scope of the session management API. Bear in mind, even when terminating one or more sessions through a support request, you are responsible for the consequences of termination.
Package Overview
The package MANAGEMENT.RDS_SESSION_MGMT contains the following procedures and functions:
-
LIST_RDS_SESSIONS (O_session_list OUT SYS_REFCURSOR): This procedure returns a list of database sessions that meet the criteria described above. -
KILL_RDS_SESSION (I_sid IN NUMBER, I_serial IN NUMBER, O_status OUT VARCHAR2): This procedure terminates a session based on the input SID (System Identifier) and SERIAL. It first validates that the session meets the RDS criteria and then looks up the instance ID to terminate the session. -
KILL_RDS_SESSION (I_audsid IN NUMBER, O_status OUT VARCHAR2): This procedure terminates sessions based on the input AUDSID (Audit Session Identifier). It retrieves the SID, SERIAL, and instance ID based on the AUDSID and then validates and terminates the session if it meets the RDS criteria.
Procedure and Function Details
LIST_RDS_SESSIONS
This procedure opens a cursor to return sessions that meet the RDS criteria.
It selects sessions from the gv$session view, filtering based on the username, schemaname, and custom patterns.
KILL_RDS_SESSION (SID and SERIAL)
This procedure first validates that the session with the given SID and SERIAL meets the RDS criteria. If the session is
valid, it retrieves the instance ID for the session and then executes an ALTER SYSTEM statement to terminate
the session.
The status of the operation is returned in the O_status OUT parameter.
