1 Home Dashboard
Retail Home is a portal-type application for the RGBU enterprise. The UI consists of a tile-based configurable dashboard that highlights important metrics and KPIs across RGBU applications. The profile-based dashboards are configured by a Retail Home administrator for each enterprise role.
Figure 1-1 Home Dashboard
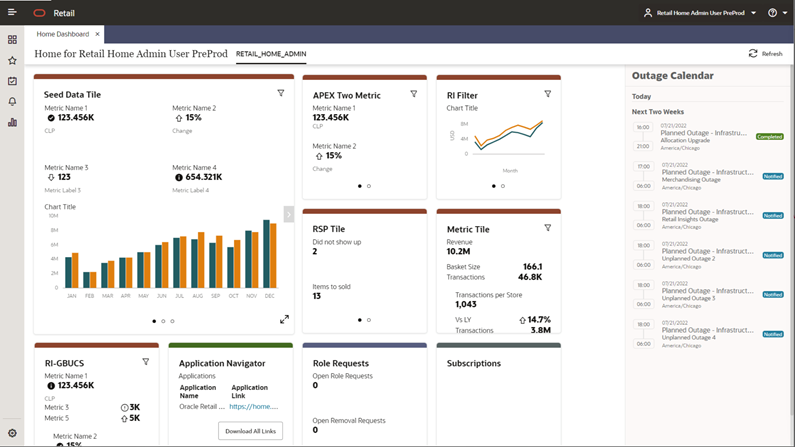
Retail Home Dashboard
The user can access the Retail Home dashboard via the Tasks menu. To access the dashboard, click Home Dashboard in the task menu.
Dashboard Controls
The user can see a set of controls at the top of the dashboard. On this bar, the user can see and select their current role and refresh the data on the dashboard.
Figure 1-2 Dashboard Controls

If there are more roles, a More link is displayed for the overflow.

Roles
Roles define what information a user sees on the dashboard. The selected role determines which tiles appear on the dashboard, and which reports, if any, appears in the banner and contextual area. Roles must be configured by an administrator before the user will see any content on their dashboard.
Users who have more than one role can switch between the roles that are assigned to them. To see the list of assigned roles, click on the Role LOV near the end of the banner.
Note:
Roles will only be listed if the user has been granted that role, and if a dashboard has been defined for that role.Tiles
The main area of the dashboard contains a collection of tiles. A tile may correspond to an application, link, or other source of information which the user can access. Inside a tile, the user may find at-a-glance information such as metrics, reports, user notifications, links, or other relevant content, depending on how the tile was configured.
Figure 1-3 Dashboard Tile
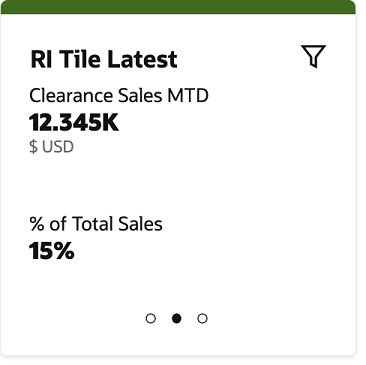
Each tile may have multiple pages of content. The user has several options to move between pages of content.
First, RGBU enterprise application tiles that have been configured to support favorites and notifications will display a favorites and notifications icon in the tile header.
Second, when the user hovers a tile, previous and next arrows will appear on the sides of the tile. By clicking these arrows, the user will move to the corresponding page in the tile.
Third, at the bottom of the tile, the user can see a row of icons corresponding to each page in the tile, where the current page's icon filled in. The user can click any of these icons to go directly to that page within the tile.
Fourth, tiles may be configured to support filter options specified by the user. Pressing the filter icon in the upper-right corner of the tile will open the filter dialog to provide values to filter data by:
Figure 1-4 Filter Dialog for a Tile
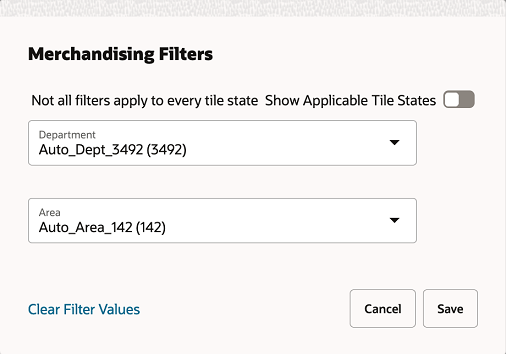
When dashboard tiles are initially loaded, if required filters do not have values entered, the following message is displayed for the corresponding tile page.
Figure 1-5 No Data to Display
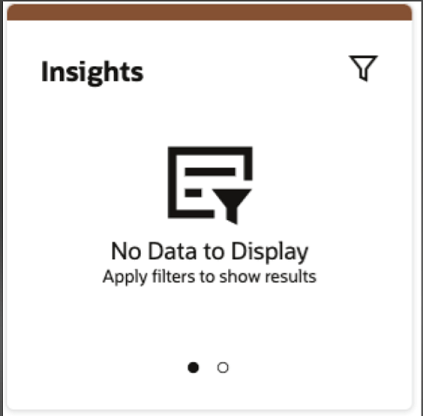
The user will have to click on the filter icon to enter the required filter values before tile page can be rendered with content.
Outage Banner
The dashboard displays a banner to let the Retail Home users know about any current outages. This banner is displayed in the same area as the batch status banner.
Figure 1-6 Outage Banner

-
The banner displays a “Some Systems are Experiencing an Outage” message with the following details:
-
Name of the application impacted by the outage.
-
Reason for the outage.
-
“Outage Started” text with the outage start time.
-
”Estimated Completion” text with the scheduled completion time.
-
-
The outage details for the application(s) are removed once the intended task is complete, even if it's before the Estimated Completion timestamp.
-
The “Estimated Completion” time is updated if the outage is extended beyond the Estimated Completion timestamp.
-
If there are than 3 outages listed on the banner, a More link is displayed for the overflow.
-
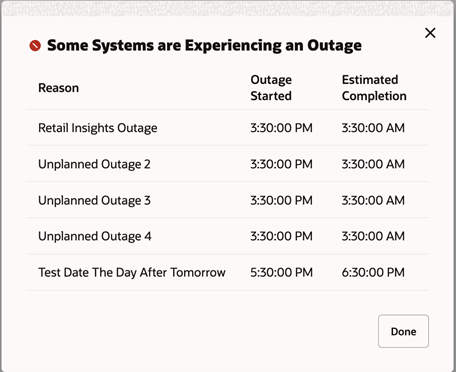
When the More link is clicked, it presents all the current outages in an error modal dialog. Click Done to close the modal dialog.
Figure 1-7 Outage Banner – All Current Outages
Batch Status Banner
The dashboard displays a banner while batch jobs are currently running or active. If there are any POM jobs currently active or running, the Batch Schedule Banner will be displayed below the Outage Banner and moves back to the top once all the outages are complete.
Note:
Some Oracle Retail Products may not allow users to access the application while a batch process is running. Please consult the product-specific documentation.Figure 1-8 Batch Status Banner

The banner displays the following for the current business date:
-
The number of jobs scheduled and the number that are complete
-
After a job is complete, a Completed status beside the job name, along with the completion time.
-
If a job is currently running, the banner shows the percentage of completion.
-
If a job hasn’t started, the banner shows 0% Complete for the job.