7 Report Configuration
This chapter describes the reports that are included with Retail Home along with requirements for their configuration.
Note:
Currently there are no report layouts for banner and contextual reports available in the release version of Retail Home
Tile State Reports
These reports are available to use on tile states within an application tile. See Dashboard Configuration for details about configuring tile states and data sources. See the "Appendix: Report Data Requirements" appendix for details about expected payloads from back-end REST services and BI.
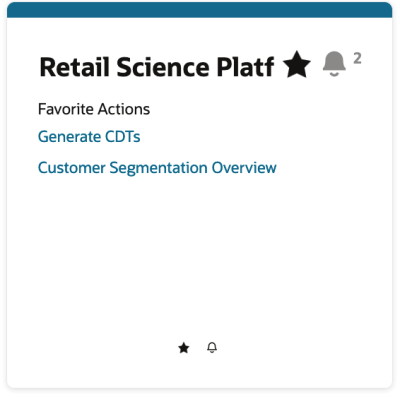
Favorites
The Favorites tile state report can be included on an application's tile if that application supports favorites. The Favorites report will display the items (tasks, reports, etc.) that have been marked as "favorite" by the user within the target application. The user can click on a favorite item to launch the favorite item in the target application within a separate browser window.
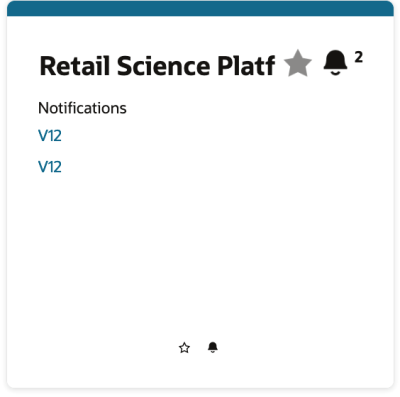
Notifications
The Notifications tile state report can be included on an application's tile if that application supports notifications. The Notifications report will display the unread notifications for the current user. The user can click on a notification to launch that notification in the target application within a separate browser window.
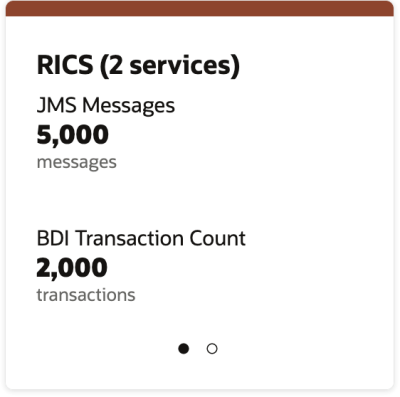
Two Metric Summary
The Two Metric Summary report displays one or two metrics in a standard layout. The data is retrieved from a service endpoint that conforms to the standard API supported by this report. Currently this report can be used to integrate with Apex. Refer to the Apex Integration section for more details.
Twelve Metric Summary
The Twelve Metric Summary report displays one to twelve metrics in a standard layout (requires a 2x2 tile). The data is retrieved from a service endpoint that conforms to the standard API supported by this report.
Figure 7-1 Twelve Metric Summary Sample
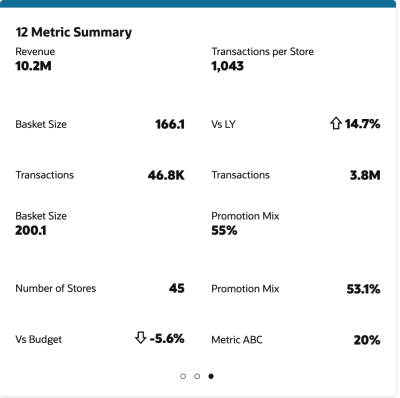
Table 7-4 Data Source Configuration
|
Name |
RetailHomeReportDataService |
|
Type |
REST |
|
Source |
https://{host}:{port}/path/to/service/endpoint |
Four or Six Metric Summary
The Four Metric Summary and Six Metric Summary reports displays one to four (or one to six) metrics plus an optional metrics chart in a standard layout (requires a 2x2 tile). These reports also display a single chart with two series or KPIs. The data is retrieved from a service endpoint that conforms to the standard API supported by this report.
Figure 7-2 Four and Six Metric Summary Samples
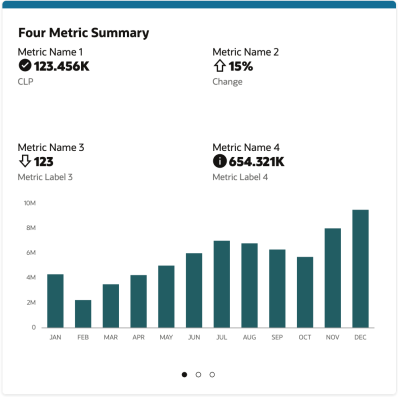
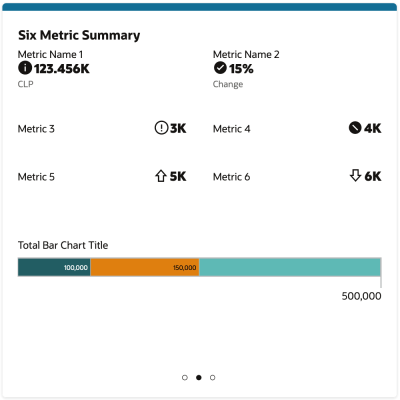
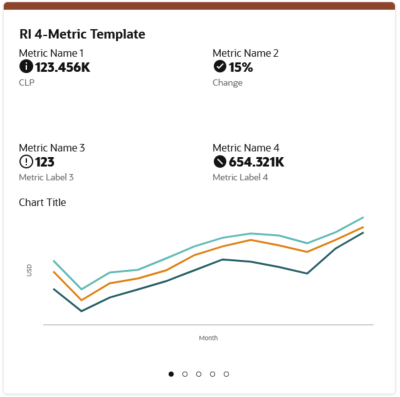
Table 7-5 Data Source Configuration
|
Name |
RetailHomeReportDataService |
|
Type |
REST |
|
Source |
https://{host}:{port}/path/to/service/endpoint |
Table Reports
The Metrics Table, Image Table and Image Metrics Table reports display data in a tabular layout (requires a 2x2 tile). The data is retrieved from a service endpoint that conforms to the standard API supported by these reports.
Figure 7-3 Metrics Table Sample
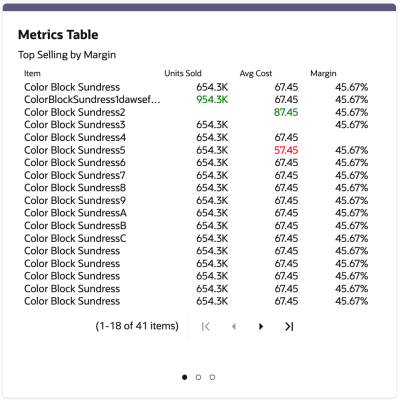
Figure 7-4 Image Table Sample
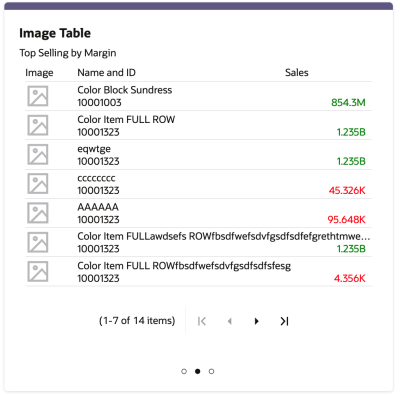
Figure 7-5 Image Metrics Table Sample
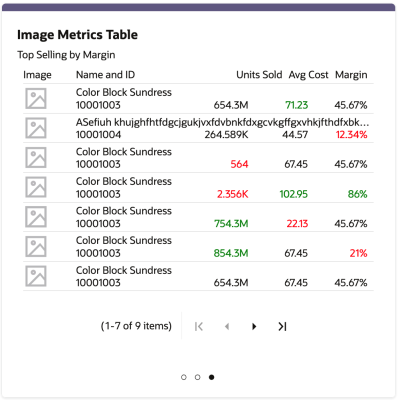
Table 7-6 Data Source Configuration
|
Name |
RetailHomeReportDataService |
|
Type |
REST |
|
Source |
https://{host}:{port}/path/to/service/endpoint |
Metric Chart Reports
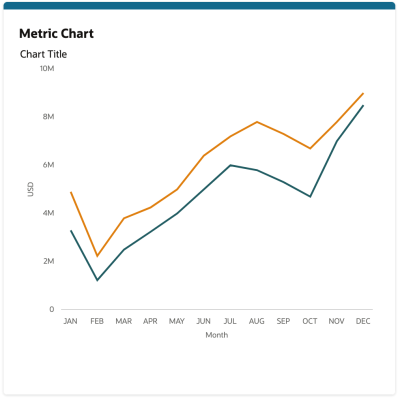
The Metric Chart reports display only a chart with no metrics on a 1x1 or 2x2 tile. The data is retrieved from a service endpoint that conforms to the standard API supported by these reports.
Figure 7-6 Metrics Chart Sample
Administrator Dashboard Tile States
There are three tiles on the default administrator dashboard that are not intended for user configuration. The Role Requests, Application Navigator, and Subscriptions tiles and their corresponding tile states are generated by default and do not make use of data sources. They are all set up to display information automatically from within Retail Home.
Tile State Report Templates
Refer to the Custom Tile State Reports Configuration section for details about the available Tile State Report Templates as well as data source configuration requirements for custom reports based on those templates.
