1 Inventory Planning Optimization-Inventory Planning
This guide describes the use of Inventory Planning Optimization-Inventory Planning (IPO-IP). For details about the implementation of IPO-IO, see Oracle Retail AI Foundation Cloud Services Implementation Guide.
Launching the Application
-
Open Retail Home.
-
Click Application Navigator, located in the left menu.
-
Click Inventory Planning.
Figure 1-1 Launching Inventory Planning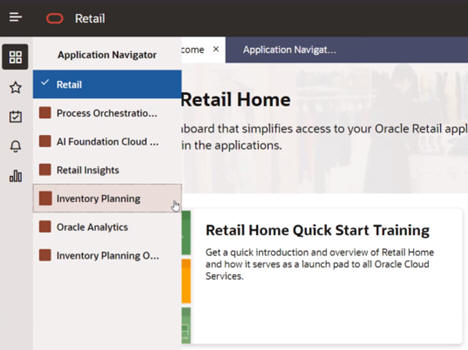
Overview
The retailer's most significant investment is the retailer’s inventory. Inventory Planning Optimization Cloud Service (IPO) offers the retailer the ability to best predict how much demand there will be and to deploy the inventory to optimize the demand throughout the course of an item's life cycle. Throughout an item’s life cycle, the application reacts to changes in consumer behavior in order to right size inventory deployment and demand methodologies. The end result allows the retailer to manage the current and future inventory at scale to ensure the right products and quantiles are in the right place for the right customers at the right time, in an automated and intelligent way, via the user interface.
Inventory Planning allows the user to view a Forecast Plan, which displays a set of products that are stocked at a set of locations during a specific time frame. Any alerts that occur during this period are highlighted. The user can then make tactical policy overrides that can then affect any future stock forecasts.
Main Filter
Use the Main filter to restrict the scope of the Plan View to a subset of products and locations.
Figure 1-2 Filter Button
The Main Filter provides a launching area providing access to the Product and Locations filters and the sub-filter Purchase Orders.
Figure 1-3 Filter Panel Card 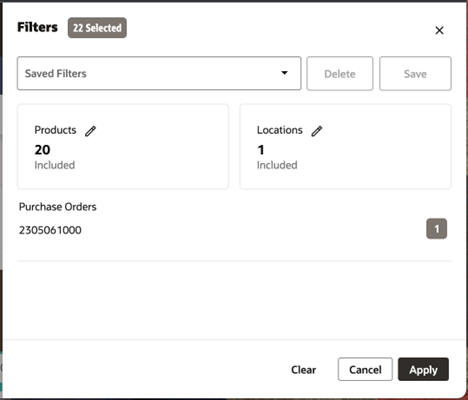
Products Filter
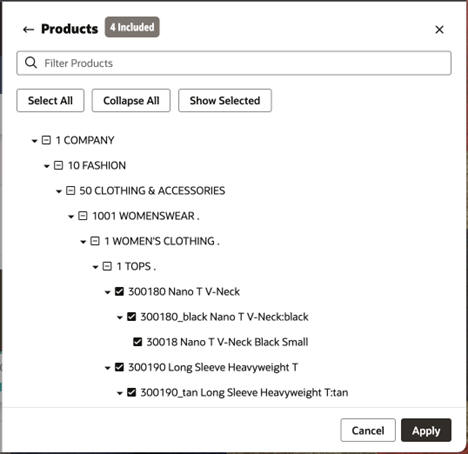
The Products filter is used to select those products that must be included in the Plan View.
Selection can occur at the individual product level or by selecting a higher level in the tree that includes all products below it at lower levels. Higher level selections are retained so that when you re-enter Inventory Planning your view will refresh to include any newly introduced products. For example, if you select a subclass, then three new products are set up on replenishment. When the products are visible to Inventory Planning, the view can be refreshed to see the additional products with no further filter selection required.
You can enter text in the Filter field at the top of the Products filter to reduce the list to those that contain that text.
Buttons are provided above the data to Select/Deselect All, Collapse/Expand All, and Show Selected/All.
Figure 1-4 Products Filter
Locations Filter
Use the Locations filter to select those locations that must be included on the Plan View.
Selection can occur at the individual Store or Warehouse level or by selecting a higher level in the tree that includes all locations below it at lower levels. Higher level selections are retained so that when you re-enter Inventory Planning your view will refresh to include any newly introduced locations. For example, if you select a district, then three new stores are set up on replenishment. When the stores are visible to Inventory Planning, the view can be refreshed to see the additional stores with no further filter selection required.
You can enter text in the Filter field at the top of the Locations filter to reduce the list to those that contain that text.
Buttons are provided above the data to Select/Deselect All, Collapse/Expand All and Show Selected/All.
The Select All button selects all visible entries, so it is the most useful after entering search text.
Figure 1-5 Locations Filter

Purchase Orders
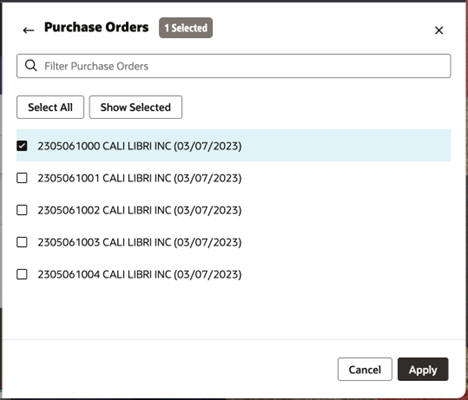
Use the Purchase Orders sub-filter to select purchase orders whose products and locations will be included on the Main filter.
Enter text in the Filter field at the top of the Purchase Orders filter to reduce the list to those that contain the specified text.
Buttons are provided above the data to Select/Deselect All and Show Selected/All.
Use Select All to select all visible entries. This is most useful after entering search text.
Use Apply a Purchase Order to automatically select the related products and locations on the Main Filter.
Figure 1-6 Purchase Orders
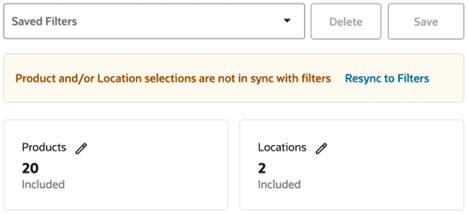
If a purchase order has been selected, and then additional products or locations are selected, then a Resync message will be displayed on the Main Filter.
If this is not what you intended, click Resync to Filters to reset both products and locations to those matching the purchase order selections.
Figure 1-7 Resync to Filters
Saving Your Filters
The entire set of filter selections can be stored for later retrieval. This is useful for creating watch lists of top items, bottom items, new locations, new product introductions, and so on.
To save a filter, enter a name into the Saved Filters field, then click the Save button.
Previously saved filter sets can be selected from the drop-down list. This will reload those saved filter selections in the Main Filter.
Figure 1-8 Saved Filters![]()
Plan View
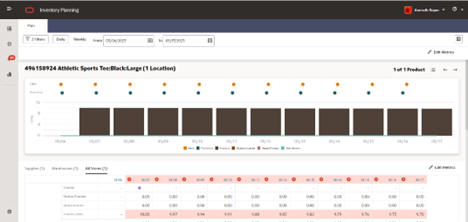
The Plan View displays information about a chosen product for a set of included locations over a time frame.
The scope of the Plan View can be adjusted using the Main Filter.
Figure 1-9 Plan View
Time Frame
The time frame of the Plan View can be set using the From and To date fields at the top.
Select Daily to display each individual day in the plan; select Weekly to show information for each week.
Figure 1-10 Time Frame

Cycle Area
The Plan View focuses on one product at any time. You can use the Cycle Area to traverse through the individual products that are included in the filter selection.
The product that is currently in focus is shown on the top left of the Plan View, along with how many of the included locations replenish it.
Figure 1-11 Current Product in Focus
Figure 1-12 Cycle Area

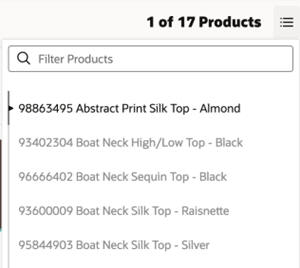
Click the Product Selection control (to the left of the arrow buttons) to display a list of products to select from. Use the search filter at the top to reduce the product list to those that contain the search term.
Figure 1-13 Product Selection
Chart
The chart area shows aggregate store information that is based upon the scope of the Plan View (Filter Selection and Time Frame).
The chart is unaffected by the Edit Metrics selection.
Figure 1-14 Plan Chart

Edit Metrics
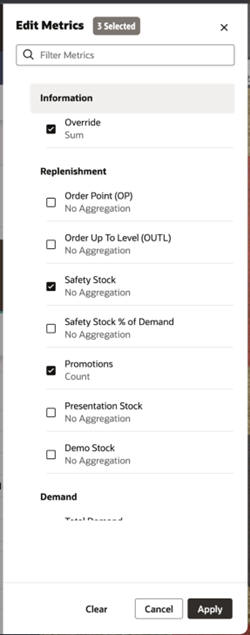
Use the Edit Metrics button to control which metrics rows appear in the Plan View tables.
Figure 1-15 Edit Metrics

Click the Edit Metrics button to display the Edit Metrics panel where you can select metrics.
For each metric, the aggregation method is shown beneath the metric name. Some metrics do not have an aggregation method and will not appear in the aggregate area tables.
Figure 1-16 Metrics Selection
Metrics
-
The Promotions metric shows the number of promotions for that time period.
-
The Override metric shows a disc at the start of any period indicating that an override has been specified by any user in Inventory Planning.
-
Definitions of the other standard metrics are included in the Inventory Planning glossary.
All Locations Table
The All Locations table aggregates data from the individual locations to display a summarized, supply chain view. As with the rest of the Plan View, this area restricts information to those locations included in the filter that replenish the product currently in focus. Only metrics related to inventory, demand, and order quantities are shown in the aggregate table. Safety stock and other target stock level metrics are reviewed in the individual location tables.
-
Supplier
-
Warehouses
-
Store
Data for the selected metrics will be shown in the tables either for each day (if Daily is selected) or each business week (if Weekly is selected).
Figure 1-17 Aggregate Area

Suppliers
The Supplier tab displays information about those suppliers that provide the product into the supply chain.
Warehouses
The Warehouse tabs displays information about those warehouses that handle the product for all the included stores. If the product passes through multiple warehouses on the way to the store, then multiple warehouse tabs will be displayed.
As this is the aggregate area, information about all warehouses listed in any individual table is combined into this table. Not all metrics apply at the Warehouse level. These metrics will not be displayed in this area.
Click a cell or the column header to open the Advanced Options (AO) panel for all the locations listed in the table for that week.
Stores
The Stores tabs show information about those stores that replenish the product.
As this is an aggregate area, information about all stores listed in any individual table are combined into this table.
Click the table data to open the AO Panel for all the locations listed in the table for that week.
No Data to Display
Each metric is only relevant at specific supply chain levels. If a product is stocked at a supply chain level but no relevant metrics are selected, then the message No Data to Display will be shown.
Figure 1-18 No Data to Display

All Locations Table Alerts
-
An up arrow will be displayed for an Overstock Alert.
-
A down arrow will be displayed for a Low Stock or Out of Stock Alert.
-
A double ended arrow will be displayed if both up and down can be shown.
Figure 1-19 Table Alerts Icons
Individual Locations Table
A table is displayed for each of the lowest level replenished locations (typically a store) that fall within the filter criteria. The primary supply chain into that location is also shown so that you can review the order projections and inventory levels throughout. The tables share a common layout to the All Locations table, including access to the supply chain. See All Locations Table.
Click the table data to open the AO Panel for all the locations listed in the table for the week that was selected.
Figure 1-20 Individual Area

Promotion Details
When a promotion exists, then a Promotions disc is shown above that time slot in the chart.
To view information about promotions, click the Promotions disc.
Figure 1-21 Promotions Discs
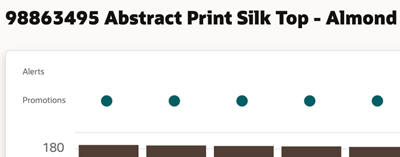
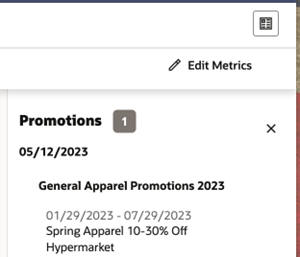
Any promotions that overlap with that time will be shown in a panel on the right.
Each promotion will also display its offers and their details.
Click the Details button (located on the right of the header) to show or hide the Promotions panel.
Figure 1-22 Promotions Details
Advanced Options Panel
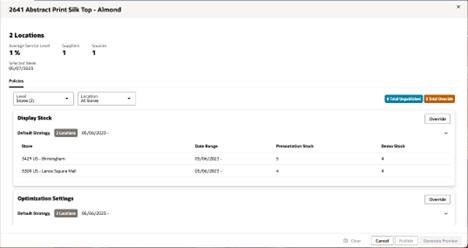
The Advanced Options (AO) panel displays more details about the product and locations for a selected week.
It always displays data based upon the entire week of the cell that you selected to launch it.
It includes information about locations, average service level, number of suppliers, number of sources and selected week, and relevant policies.
Figure 1-23 AO Panel
Summary Area
The Summary area displays information that applies to the entire AO Panel.
This includes information about locations, average service level, number of suppliers, number of sources and selected week, and relevant policies.
All navigation in the AO Panel will be within the supply chain of these locations and selected week.
Policies Tab
The Policies tab displays all policies that are defined in the Strategies application for the product, selected week, and locations, as set by the Level and Location field.
Level and Location
The Level and Location fields permit navigation up and down the supply chain for the product and selected week.
The Level field provides selection of the supply chain tier, for example, Warehouses or Stores.
You can select an individual or all of the locations within the selected level in the Location field.
Figure 1-24 Level and Location Fields
Policy Table
Each policy type (as defined in the Strategies application) will have a card on the Policies tab.
If policy types are defined or overridden, then they are displayed in a table. If none are defined, then an Override button is still available.
| Columns | Explanation |
|---|---|
| Stores/Warehouses | The locations that have defined policies. |
| Data Range | The dates for when the policy applies. Note that it is possible to not specify an end date if the policy is continual. |
| Policy Values | One column is provided for each field that is part of the policy (e.g., Presentation Stock). |
Policies from the Strategies Application
All data directly from the Strategies application are displayed within the white Default Strategy tables.
Override
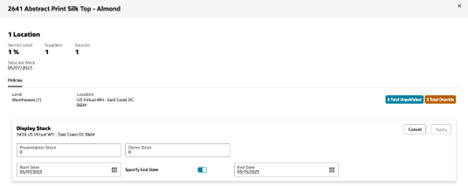
Use the Override button to input new policy overrides for the locations selected in the Locations field.
Click the Override button to display an edit area.
Figure 1-27 Override Button

- Policy Fields: Fields that can each be altered.
- Start Date: The first date of the alteration.
- Specify End Date: A switch that allows no end date to be specified.
- End Date: The last date of the alteration (not displayed if the Specify End Date is toggled off).
All alterations must overlap with the AO Panel's Selected Week.
Figure 1-28 Edit Area
AO Panel Main Buttons
The main set of buttons are positioned at the bottom of the AO Panel. These perform operations upon the entire AO Panel.
Figure 1-29 AO Panel Buttons
Clear
Click the Clear button at the bottom of the AO Panel to clear all data from the tables on the AO Panel.
Only data after today's date is cleared.
Note that all alterations will be lost unless either the Publish or Generate Preview buttons are used.
Publish
When you use the Publish button, all alterations on the AO Panel will be used to adjust the plan.
This sends all AO Panel alterations to the Science application for integration into the plan.
A notification is created when any Publish action is completed or fails.
Generate Preview
When you use the Generate Preview Publish button, all alterations on the AO Panel are used to create a preview. The preview displays what will happen to the plan if the alterations are made.
This sends all AO Panel alterations to the Science application for the calculation of the preview.
A notification is created when any preview creation completes or fails.
Preview
A Preview displays a what if scenario, based upon the application of a set of alterations from an AO Panel to the plan.
Use the Preview Success Notification to open a preview.
A preview is based upon a single product for a set of locations; it opens in a new tab within the IP application.
-
Aggregate chart
-
Aggregate area with supply chain navigation
-
Individual area with supply chain navigation
-
Promotions
-
Edit metrics
Figure 1-30 Preview

Preview Main Buttons
A set of buttons are positioned at the bottom of the Preview. These perform operations upon the entire Preview.
Figure 1-31 Preview Buttons
Publish
When you use the Publish button, all alterations from the original AO Panel are used to adjust the current plan.
All the alterations to the Science application for integration into the plan.
A notification is created when the action is complete.
Update Preview
Click the Update Preview button to resend the alterations that you used to make this preview in order to understand how this affects the current plan.
This is useful if changes have occurred since the preview was created and the information must be refreshed.
A new preview will be created to replace the existing one and can be opened using its Preview Ready notification.
Notifications
When the application performs an asynchronous operation that may take some time, it often creates a notification when it successfully completes or fails.
-
Publish Completed. A publish operation has successfully completed.
-
Review Ready. A preview has successfully completed its calculations and is ready to be viewed. Clicking on this kind of notification will show the generated preview.
-
Failure. Failure notifications are created when something errors during the calculation process. These often include the functionality that when clicked they retry the failed operation again.
Notifications Table
When you display the list of notifications in the left navigator, you can click See All (located at the bottom of the Notifications panel) to see the Notifications table. This provides a full list of the current notifications as well as further details.
Figure 1-32 Notifications Table

Workflows
This section describes the workflows.
View a Plan
Use the main plan view to perform the major part of your analysis. This view helps to break down the components of the inventory and provides insights into the calculated target stock levels (Order Point (OP) and Order Up to Level) that drive ordering. In this view you see receipts increasing inventory but also see the order recommendations on the order date. These order recommendations create demand on the source that can be viewed in the warehouse or supplier tab, depending on the location's source.
To view a plan, complete the following steps:
-
Launch the Inventory Planning application (see How To Launch).
-
Enter your time frame (see Time Frame).
-
Define the products and locations using the filter (see Main Filter).
-
Click Apply on the Main Filter to update the Plan View based on your choices.
-
Use the Cycle area arrows in the top right to navigate through the products (see Cycle Area).
-
The chart and tables always display information about the product that is in focus.
-
Use the Supply Chain tabs to inspect metrics from the supplier, warehouses, or stores (see All Locations Table).
Override Safety Stock Levels for Set of Stores
-
View a plan that contains the desired product, locations, and time frame (see View a Plan).
-
Click the Aggregate table, in the Stores Tab column header for a week that overlaps the time that you wish to update.
-
The AO Panel is displayed. The level and location do not require updating (see Advanced Options Panel).
-
Scroll down until the Optimization Setting policy type is visible.
-
Click the Override button to the right of the Optimization Settings table (see Policy Tables).
-
The Edit Area is displayed.
-
Update the Min and Max fields as desired, along with the start and end dates for the time period for the changes.
-
Click Apply to redisplay the policy tables with the updates.
-
A new row appears in a unpublished table for the optimization settings.
-
Click the Publish button at the bottom of the AO Panel (see AO Panel Main Buttons).
-
When the processing is completed, a Publish Completed notification is created (see Notifications).
-
To see a plan that contains the updates, view a plan that contains the same product, locations, and time frame (see View a Plan).
Override Service Levels
-
View a plan that contains the desired product, locations, and time frame (see View a Plan).
-
Click the Aggregate table in the Stores Tab column header for a week that overlaps the time that you want to alter.
-
The AO Panel is displayed. The level and location do not require updating (see Advanced Options Panel).
-
Scroll down until the Service Level policy type is visible.
-
Click the Override button to the right of the Service Level table (see Policy Tables).
-
The Edit Area is displayed.
-
Update the Service Level field as desired, along with the start and end dates for the time period for which you want to make the changes.
-
Click Apply to redisplay the Policy tables with the updates.
-
A new row is displayed in an unpublished table for the Service Level.
-
Click the Publish button at the bottom of the AO Panel (see AO Panel Main Buttons).
-
When the processing is completed, a Publish Completed notification is created (see Notifications).
-
To see a plan that contains the updates, view a plan that contains the same product, locations, and time frame (see View a Plan).
Override Inventory Selling Days
-
View a plan that contains the desired product, locations, and time frame (see View a Plan).
-
Click the Aggregate table, in the Stores Tab column header for a week that overlaps the time that you want to update.
-
The AO Panel is displayed. The level and location do not require updating (see Advanced Options Panel).
-
Scroll down until the Optimization Settings policy type is visible.
-
Click the Override button to the right of the Optimization Settings table (see Policy Table).
-
The Edit Area is displayed.
-
Update the Inventory Selling Days field as desired, along with the start and end dates for the time period you want to update.
-
Click Apply to redisplay the Policy tables with the updates.
-
A new row appears in a Unpublished table for the Optimization Settings.
-
Click the Publish button at the bottom of the AO Panel (see AO Panel Main Buttons).
-
When the processing is complete, a Publish Completed notification is created (see Notifications).
-
To see a plan that contains the updates, view a plan that contains the same product, locations, and time frame (see View a Plan).
Generate a Preview
-
View a plan that contains the desired product, locations, and time frame (see View a Plan).
-
Click the Aggregate table in the Stores Tab column header for a week that overlaps the time that you want to update.
-
The AO Panel is displayed. The level and location do not require updating (see Advanced Options Panel).
-
Scroll down until the policy type that you want to update is visible.
-
Click the Override button to the right of the Policy Type table (see Policy Tables).
-
The Edit Area is displayed.
-
Update the Policy fields as desired, along with the start and end dates for the time period you want to update.
-
Click Apply to redisplay the Policy tables with the updates.
-
A new row appears in a Unpublished table for the policy that you updated.
-
Click the Generate Preview button at the bottom of the AO Panel. These changes are made in a new preview only. This preview shows what happens if the updates are made (see Generate Preview).
-
When the processing is completed, a Preview Ready notification is created (see Notifications).
-
Click the Notification to launch the newly created preview that shows what the plan looks after the updates are published.
-
You can now inspect the preview to see the impact of the updates, then either reject, save and close, or publish (see Preview Main Buttons).
View Alerts
-
Launch Retail Home.
-
Use the Application Navigator to launch OAS (Oracle Analytics).
-
Click Catalog, Shared Folders.
-
Click IPO - Optimization.
-
Open report Inventory Alerts
Note:
Depending on your implementation, this report may not be available. If it is available, it may be customized for your company's precise business process.Figure 1-33 Alerts Reports
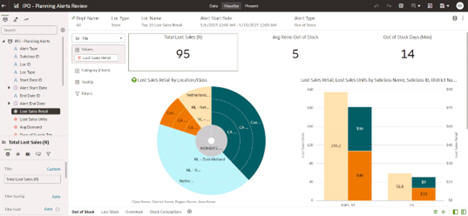
- All current alerts will be shown.
-
To see these alerts in Inventory Planning, right-click the bar chart on the right and select Open IPO - Planning.
Figure 1-34 Launch into Inventory Planning
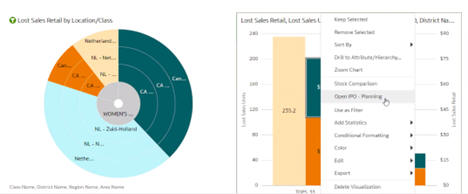
- The Inventory Planning application will launch already filtered to the products and locations from the report.
-
Use the Cycle Area to select the desired product.
-
The Plan View will update to show information about that product.
-
Any alerts will be highlighted in the tables.
Resolve Alerts
Many inventory issues result from a difference in sales compared to the forecast. These issues tend to be resolved reactively with substitutions, manual inventory transfers, or even markdowns because the forecast is not perfect. Other issues arise from unplannable factors outside of your control such as product recalls, manufacturing issues, or shipping delays or errors. Similar manual resolutions ensue.
-
Effectively defined alert thresholds ensure that these issues will be highlighted for you.
-
Other key items, hot buys, or new product introductions that are on your daily or weekly to-watch list may not break the alert thresholds but can follow the same analysis to adjust inventory to a more suitable level.
While each situation requires expert knowledge of the business goal, use the following recommendations to get started considering the best resolution to projected inventory issues. These recommendations may resolve a particular problem; however, the same frequently occurring inventory issue will require additional analysis of the supply chain inventory levels, supplier compliance, and potential shipping issues before resorting to a long term policy override.
- Use the Plan View to review the forecasted sales and inventory.
- Where an inventory issue is identified, use the Order Point (OP) and Order Up to Level (OUTL), on or just before the problem occurs, to identify when the minimum (OP) and target inventory levels (OUTL) do not align with forecast sales and desired service level.
- When OP or OUTL requires adjusting, open the AO Panel by clicking in the cell of the review day/item/location(s) that require adjustment.
- When an issue occurs in a large concentration of stores, the warehouse
stock levels could be an issue. Consider reviewing the warehouse
replenishment policies and follow the same recommendations.
Issue Replenishment Method Policy Adjustment Out of Stock Min/Max -
Create a Stock Level Override, set Increment % to a value greater than 1 to increase OP / OUTL to align with increased forecasted sales.
Time Supply -
Ensure that Max Safety Stock Units/Days is not constraining OP, allowing inventory to get too low before re-ordering.
-
Create an Optimization Setting override, increase Inventory Selling Days (relative to Max Time Supply) to increase OUTL.
Dynamic -
Ensure that Max Safety Stock Units/Days is not constraining OP, allowing inventory to get too low before re-ordering.
-
Create an Optimization Setting override, increase Inventory Selling Days to increase OUTL
Low Stock Min/Max -
Create a Stock Level Override, set Increment % to a value greater than 1 to increase OP / OUTL to align with increased forecasted sales.
Time Supply -
Ensure that Max Safety Stock Units/Days is not constraining OP, allowing inventory to get too low before re-ordering.
-
Optionally,
-
create an Optimization Setting override, increase Inventory Selling Days (relative to Max Time Supply) to increase OUTL. This creates a fixed target for inventory days of supply.
-
or create an Optimization Setting override, set Min Safety Stock Units or Days to a value that helps to carry extra stock for volatile sales or shipping delays. This allows inventory days of supply to more flexibly adjust while ensuring a minimum level of safety stock is achieved to reduce the chance of an out of stock.
-
Dynamic -
Ensure that Max Safety Stock Units/Days is not constraining IP, allowing inventory to get too low before re-ordering.
-
Optionally,
-
create an Optimization Setting override, increase Inventory Selling Days to increase OUTL. This creates a fixed target for inventory days of supply.
-
or create an Optimization Setting override, set Min Safety Stock Units or Days to a value that helps to carry extra stock for volatile sales or shipping delays. This allows inventory days of supply to more flexibly adjust while ensuring a minimum level of safety stock is achieved to reduce the chance of an out of stock
-
-
In rare cases, create a Service Level override to increase Service Level for key in-stock periods e.g. holiday
Overstock Min/Max -
Create a Stock Level Override, set Increment % to a value less than 1 to decrease OP / OUTL to align with a slow period of forecasted sales.
Time Supply -
Ensure that Min Safety Stock Units/Days is not increasing OP undesirably.
-
Optionally,
-
create an Optimization Setting override, decrease Inventory Selling Days (relative to Min Time Supply) to decrease OUTL. This creates a fixed target for inventory days of supply.
-
or create an Optimization Setting override, set Max Safety Stock Units or Days to a value that helps limit the ordering frequency by helping to limit OP.
-
Dynamic -
Ensure that Min Safety Stock Units/Days is not increasing OP undesirably.
-
Optionally,
-
create an Optimization Setting override, decrease Inventory Selling Days to decrease OUTL. This creates a fixed target for inventory days of supply.
-
or create an Optimization Setting override, set Max Safety Stock Units or Days to a value that helps limit the ordering frequency by helping to limit OP.
-
- In rare cases, or nearing end of life, create a Service Level override to decrease Service Level. This will reduce inventory but could increase risk of out of stocks if actual sales increase.
-
**can only take affect for review days
Glossary of Inventory Planning Terms
| Term | Definition |
|---|---|
| Alert | Alerts are defined in the Strategies application. Each Alert has trigger conditions (e.g., stock level dropping below a threshold) that also includes the set of products and locations to which it applies. See Strategies User Guide for further details. |
| AO Panel | The abbreviation for the Advanced Options Panel. |
| Average Service Level | The average of the service levels during the selected week. |
| Backorder | Inventory that was already sold but could not be fulfilled due to there being no physical inventory at the time of sale. |
| Constrained Demand | Total constrained demand used by the Distribution Engine to calculate inventory positions (and order boundaries within lead time). For stores this is the forecast demand. For warehouses this is constrained demand from destinations. |
| Demand | The total amount of forecasted demand. |
| Demo Stock | Stock that cannot be sold. |
| Filter Selection | The Main filter allows the scope of the Plan View to be restricted to a subset of products and locations. This is also known as the Filter Selection. |
| Inventory (BOP) | Beginning of day inventory at a location. It is Stock on Hand, or yesterday's Inventory (BOP) + all inbounds yesterday - all demands yesterday. Inventory is never negative. |
| Lost Sales | day's inventory + inbound available - demand |
| Lost Sales % of Demand | Lost Sales / Total Demand |
| Order Forecast | Constrained demand on source (including supplier). Calculated based on the (constrained) Receipt Forecast, the Order Forecast shows when users can expect their transaction to be generated. |
| Order Point (OP) | Order Point. |
| Order Up To Level (OUTL) | Order up to level. |
| Plan View Scope | The filter selection and the time frame that restrict the results on the Plan View. |
| Presentation Stock | Input to Replenishment engine from strategies/RMS. |
| Receipts Expected | On-Order Inventory at the destination location shown on the day that it should arrive. |
| Receipts Forecast | Forecasted Inventory that is constrained by the Order and Distribution Plan. This inventory does not live on a transaction yet. The Forecasted Receipts are shown on the day that they should arrive at the destination location. |
| Safety Stock | Based on the identified need and the volatility in sales for this is additional units that are needed to ensure lost sales do not occur. |
| Safety Stock % of Demand | Safety stock units as a % of demand (total demand) over review time. |
| Selected Week | This is the week that the AO Panel is focused upon. The AO Panel always displays data based upon the entire week of the cell that was selected to launch it. |
| Time Frame | The period between the from and to dates. These are shown at the top of the Plan View. |
| Total Demand | Total or all unconstrained demand used by the Distribution Engine to calculate safety stock and order boundaries. |

