Overstock
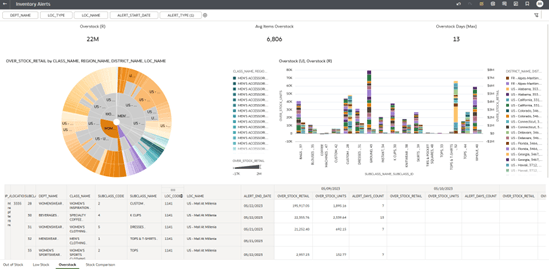
The Overstock report is structured with a header section and three distinct analytical canvases, each delivering a specific perspective on overstock conditions to facilitate thorough analysis and support data-driven decision-making.
This alert type is indicating that stock exceeds what is needed for the next review period (ordering opportunity). Due to the way this alert has been approached it does not attempt to validate the replenishment policies themselves, rather alert users when stock is greater than the target stock level as defined by the replenishment policy; meaning the safety stock/target stock levels are assumed to be accurate and representative of the business' need.
In this context, an Overstock event is defined as any occurrence activated by the Overstock Alert, in accordance with the parameters and rules configured within the Alert Management tool.
Figure 1-39 Inventory Alerts - Overstock

Header Section
At the top of the report, a header presents three key performance indicators (KPIs) that encapsulate essential metrics related to overstock situations:
- Overstock (R): Displays the total value of overstock in retail currency (R) across all relevant products and locations within the selected time frame.
- Average Items Overstock: Shows the average number of distinct items that were overstock, providing an indicator of the overall breadth of overstock issues.
- Overstock Days (Max): Indicates the maximum number of consecutive days an item was overstock, helping to identify severe or prolonged high level of stock.
These tiles serve as quick, high-level indicators of the overall impact of overstock on business performance based on the filter defined by the user.
Canvas 1 – Overstock (Retail) by Class and Location
The first canvas provides a visual representation of overstock in retail value segmented by product class and location. Positioned in the top-left corner of the screen, a radial (circular) chart illustrates Overstock (R), broken down by both class and location (store or distribution center) enabling users to quickly identify areas with the greatest financial impact resulting from overstock situations.
Canvas 2 – Overstock (Unit and Retail) by Subclass and District
The second canvas offers a comparative analysis of overstock, focusing on both unit and retail value metrics:
A bar chart is used to display:
-
Overstock (U): Total quantity of units classified as overstock.
-
Overstock (R): The total retail value of units classified as overstock, calculated by multiplying the quantity of overstocked items by their respective retail prices.
These metrics are segmented by District and Subclass.
Canvas 3 – Detailed Data Table
The third canvas contains a comprehensive data table that provides detailed, time-phased metrics for in-depth analysis.
The table includes the following key metrics:
-
OVER_STOCK_RETAIL: The monetary value of inventory classified as overstock, representing the total retail worth of surplus stock exceeding the defined thresholds.
-
OVER_STOCK _UNITS: The total number of units exceeding the predetermined stock level, indicating the quantity of inventory above the acceptable stock limits.
-
ALERT_DAYS_COUNT: The number of days during which the overstock condition persisted.
Data is presented in a time-phased format, showing the specific days when overstock occurred, allowing users to identify patterns, trends, or recurring issues over time.
Additionally, the table displays the hierarchical structure above the Subclass level (Class and Department).
This detailed breakdown enables users to perform granular analyses of alert events, understanding not only when they occurred but also how they relate to the broader organizational structure of products and locations.