Low Stock
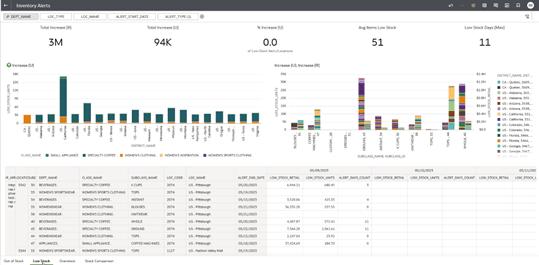
The Low Stock report is structured into a header section and three distinct canvases, each offering a different perspective on Low Stock occurrences to support comprehensive analysis and informed decision-making.
This alert will begin by calculating average forecast demand for each week until the lesser of (planning horizon, # of days to review) from Today. Then determine which days' inventory falls below (Days of supply x Average Forecast Demand). In order for an item/location/day to be Low Stock it must not be triggered by Out of Stock alert. An item/location cannot be alerted for both Out of Stock and Low Stock. A day may have lost sales and does not meet the rules for OOS alert, but does meet the Low Stock rules. This means Out of Stock checks must be completed for item/location/day before Low Stock checks.
In this context, a Low Stock event refers to any occurrence triggered by the Low Stock Alert, based on the rules defined within the Alert Management tool.
Figure 1-38 Inventory Alerts – Low Stock

Header Section
At the top of the report, a header displays five key performance tiles summarizing critical metrics related to low level of stock situations:
- Total Increase (R): Represents the total value of Low Stock, expressed in retail currency (R), across all relevant products and locations within the selected time frame.
- Total Increase (U): Represents the total quantity of Low Stock, measured in units (U), across all relevant products and locations within the selected period.
- % Increase (U): Shows the percentage of Low Stock units relative to average demand, highlighting the significance of the stock shortage in relation to item demand.
- Avg Items Low Stock: Displays the average number of distinct items categorized as Low Stock, providing insight into the overall breadth of stock issues.
- Low Stock Days (Max): Indicates the maximum number of consecutive days an item was out of stock, helping to identify severe or prolonged stock level problems.
These tiles offer quick, high-level indicators of the overall impact of Low Stock on business performance, tailored to the filters selected by the user.
Canvas 1 – Low Stock (Unit) by Class and District
The first canvas offers a visual representation of Low Stock quantities, segmented by product class and district. A bar chart, positioned in the top-left corner of the canvas, illustrates Low Stock (U) broken down by both class and district, enabling users to quickly identify where the highest concentrations of Low Stock are occurring.
Canvas 2 – Low Stock (Unit and Retail) by Subclass and District
The second canvas offers a comparative analysis of Low Stock, focusing on both unit and retail value metrics.
A bar chart is used to display:
-
Low Stock Units (U): Represents the total number of product units flagged as Low Stock within the reporting period, based on the predefined thresholds set in the Alert Management tool. This metric helps quantify the physical extent of inventory shortages across subclasses and districts.
-
Low Stock Retail (R): Represents the total retail value of all products classified as Low Stock, calculated by multiplying the unit retail price by the corresponding quantity of Low Stock units. This metric provides a financial perspective on the potential revenue at risk due to Low Stock conditions.
These metrics are segmented by District and Subclass.
This view helps users analyze how different geographical areas and product segments contribute to the low level of stock, supporting more targeted inventory management strategies.
Canvas 3 – Detailed Data Table
The third canvas contains a comprehensive data table that provides detailed, time-phased metrics for in-depth analysis:
The table includes the following key metrics:
-
LOW_STOCK_RETAIL: The monetary value of low level of invetory.
-
LOW_STOCK_UNITS: The total number of product units classified as Low Stock based on their relationship to the demand forecast. This metric indicates instances where available inventory falls below the expected demand threshold, signaling potential risks of stockouts and unmet customer deman.
-
ALERT_DAYS_COUNT: The number of days during which the Low Stock condition was active.
Data is presented in a time-phased format, showing the specific days when low stock occurred, allowing users to identify patterns, trends, or recurring issues over time.
Additionally, the table displays the hierarchical structure above the Subclass level (Class and Department)
This detailed breakdown enables users to perform granular analyses of Low Stock events, understanding not only when they occurred but also how they relate to the broader organizational structure of products and locations.